TCUP Edge Service
Introduction
TCUP EDGE is an IoT platform which is designed to run on resource constrained and low memory footprint devices for addressing the need of a stable, robust and easy to implement IoT based solution. It is usually installed on industrial grade IoT gateway devices but can also be installed on any commodity hardware like laptop or desktop with any Linux flavored OS installed. In short it is a light weight minified version of cloud platform which contains basic capabilities required to implement an IoT solution in a restricted environment on the device side.
Edge Portal
TCUP Edge Portal provides an interface to get the insight of various activities happening in a gateway device. It reflects the real time health status of all the components hosted as part of edge offering. A user can define various filtering and analytics rule through this portal. Different kinds of system and application alerts and notifications can be viewed. There is a control settings provided to turn on or off any component which is deployed as part of the edge ecosystem. It provides direct visibility to various devices and sensors posting data to the gateway with real time charts. Also various background processes and their execution status can be monitored and configured.
This portal is running on Edge Device and each device has its own portal.
Purpose of the Document
This document describes how to work with Edge Portal. After going through this document user will able to perform various activities from Edge Portal as described in the above section
Reference Document
Please refer the following documents to get more details on Edge service
To understand the basic concepts of Edge Service please refer the Concept guide.
For API details please refer the API guide.
Working with Edge Portal
Accessing Edge Portal
To access Edge portal from the device go the browser. This portal is officially supported on Chrome and Firefox browser. Enter the URL in the browser address in the format :
https://<domainName>or<ipAddress>/

Home Page
After providing the user id /Password you will be landed on the edge home page as shown below.
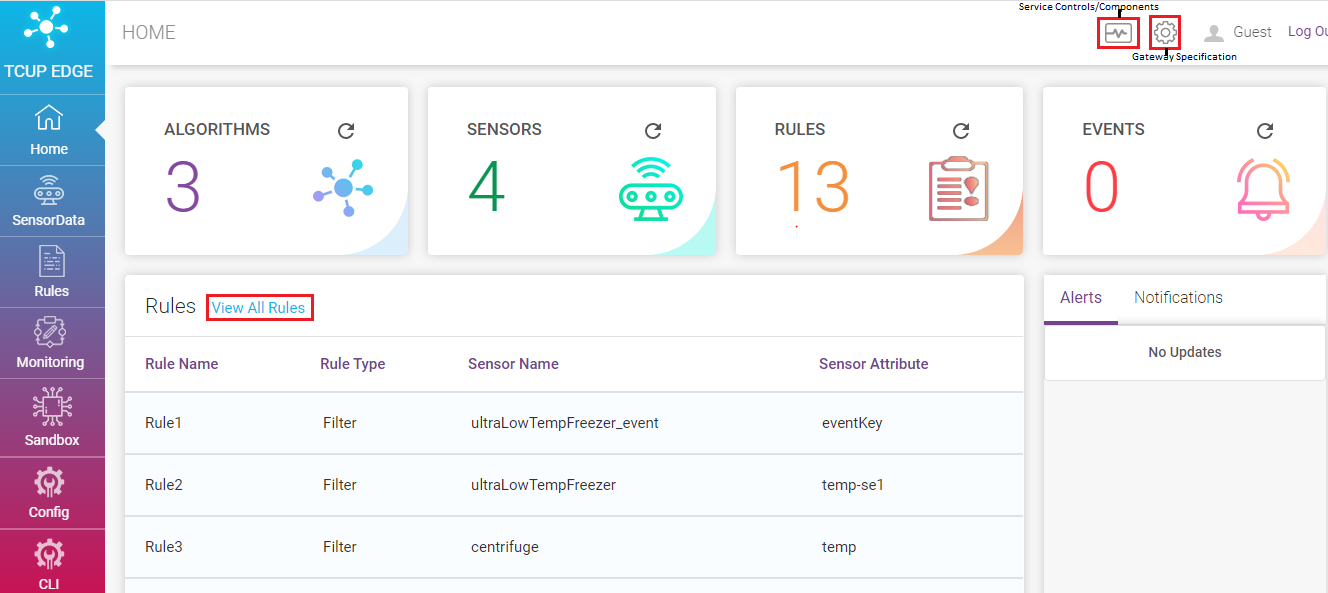
It gives an overview of current state of edge ecosystem containing information :
No. of Algorithm, Sensors, Rules and Real Time Events
Preview of Rules Page: Rules configured over real time streaming data. There’s also a link to the rule configuration page.
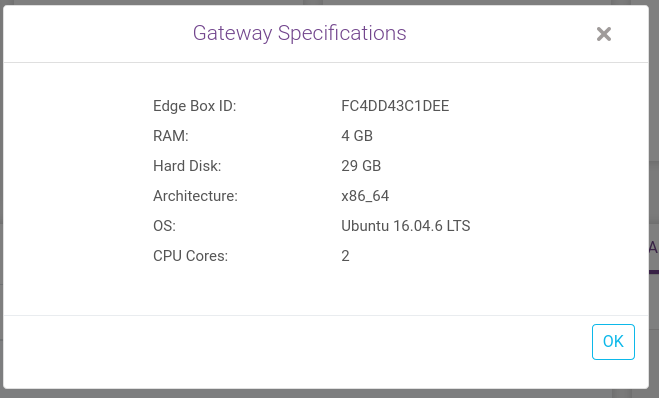
Link to Gateway Specification : An example of specifications is given below
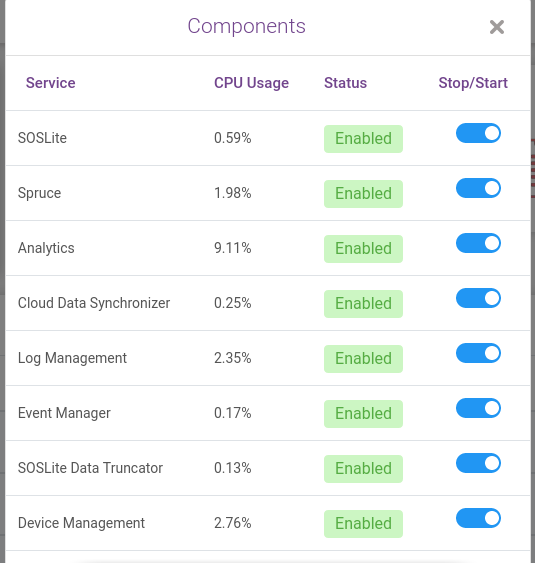
Link to Service Controls : Control settings to turn on or off any component as per user requirements as shown below.
Rules
User can navigate to Rule page either by clicking View All Rules link on home page or by clicking Rules on the left hand side menu.
It enables feature like create, search , edit and delete rule.
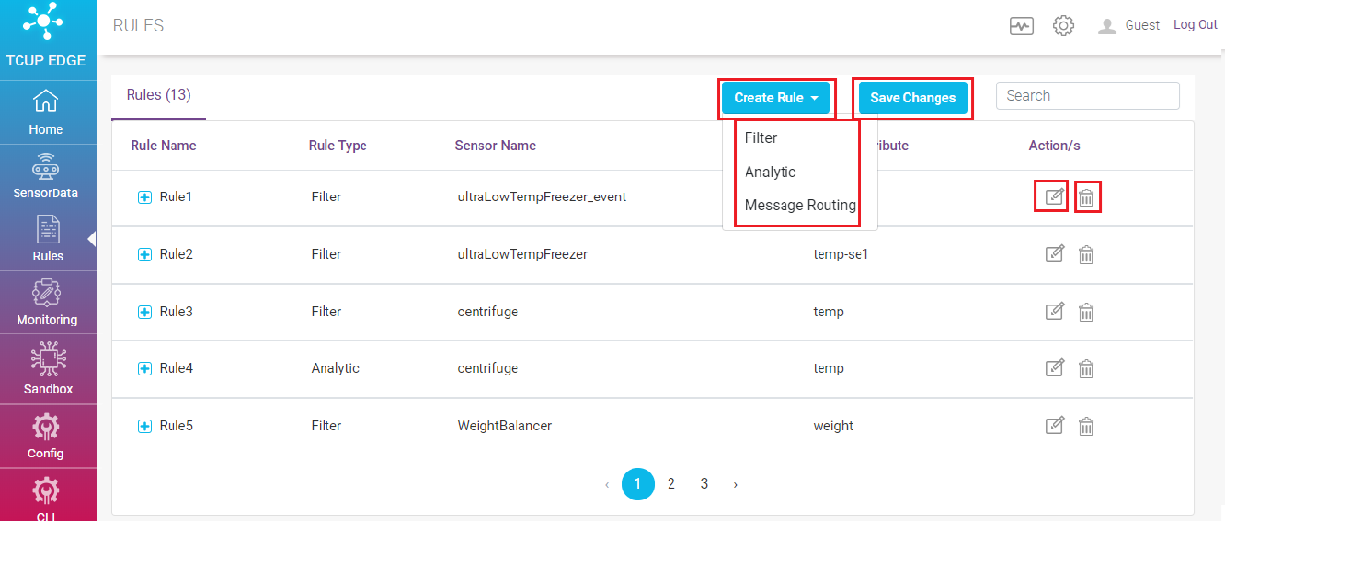
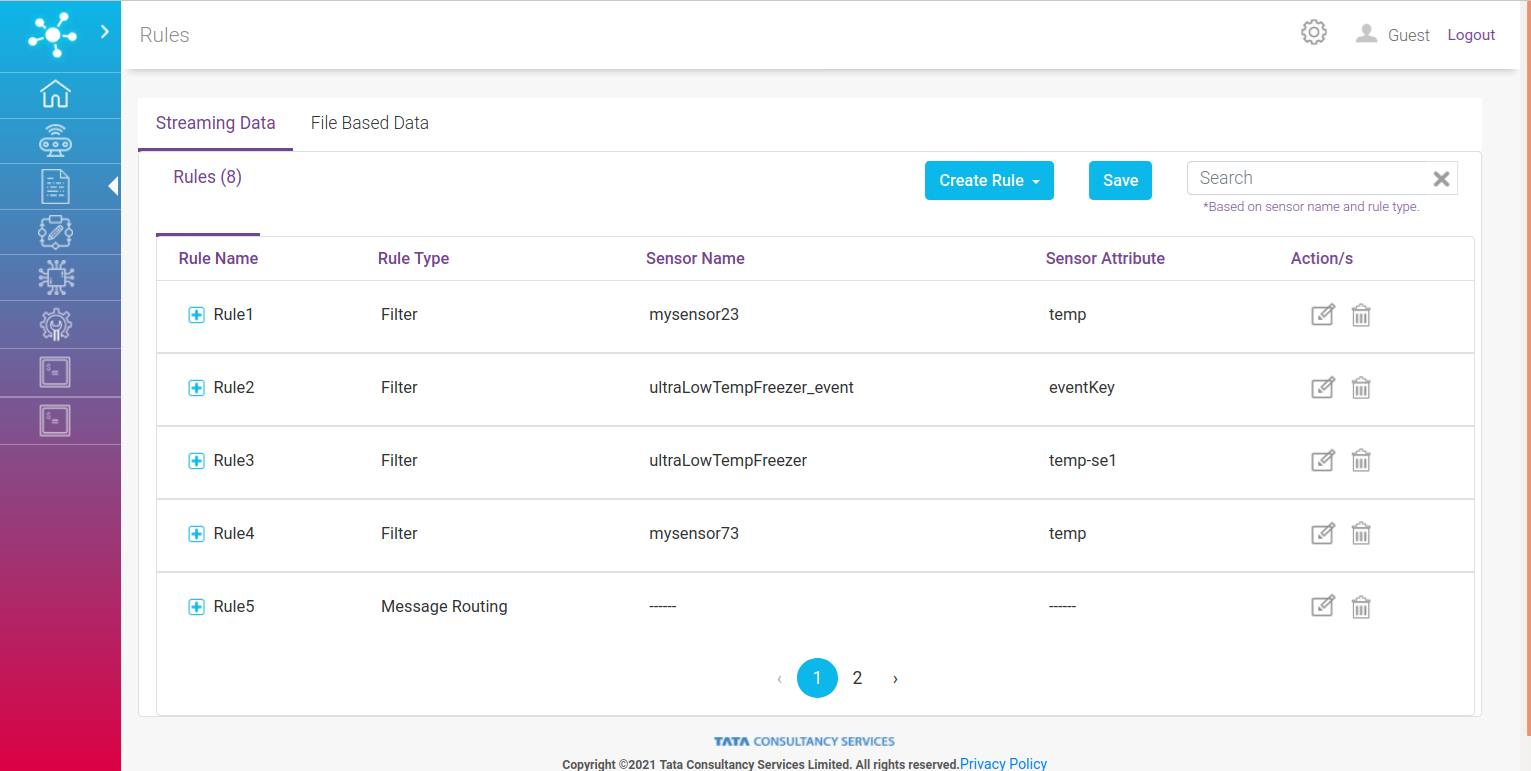
As shown in the picture above there are two categories of rules:
Streaming Data Rules
File Based Data Rules
Streaming Data
This rule type has three subcategories :
As shown in the screen above user can create three of rules:
Filter Rule
Analytics Rule
Message Routing Rule
Filter Rule
Filter Rule filters data based on mentioned filter type and sends the output to end points defined in actions. On clicking on Filter rule following form appears
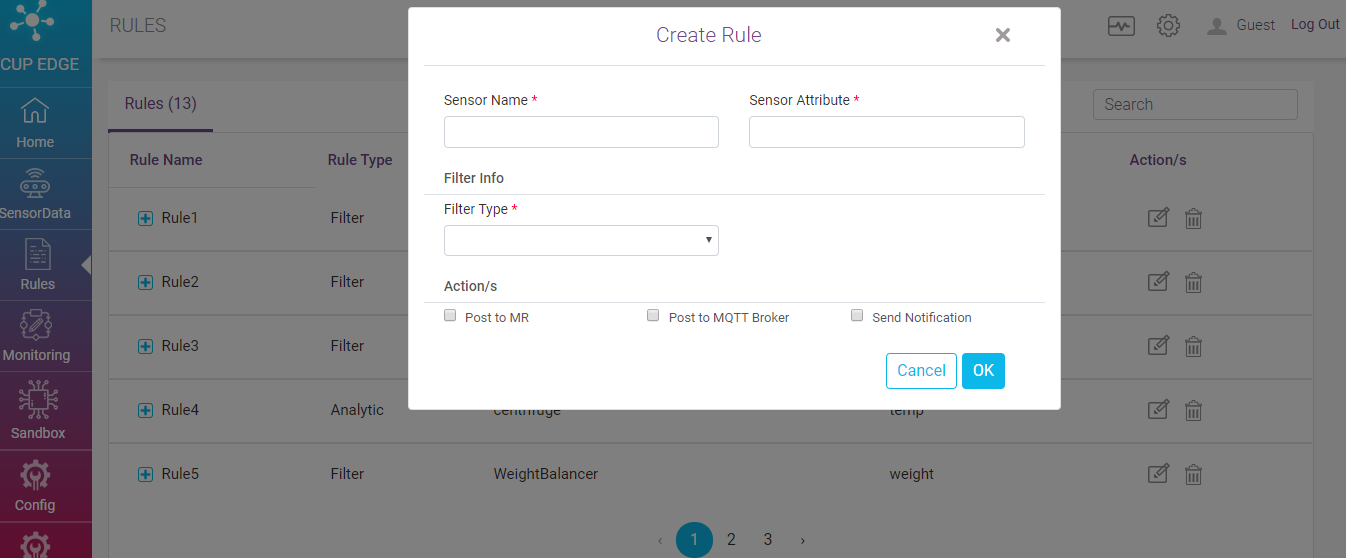
Sensor Name - Specify the name of the sensor against which the rule to be created
Sensor Attribute - Specify the attribute of the sensor
Filter Type - Specify the filter type. Available options are
less than
greater than
equal to
between
outside
Actions - Select action type from the available option. This field is not mandatory. If not mentioned the action will be default action mentioned in SPRUCE setting.
Analytic Rule
Analytic Rule enables out of the box as well as custom batch oriented analytics model execution on a window of real time streaming data. On clicking on Analytic rule following form appears.
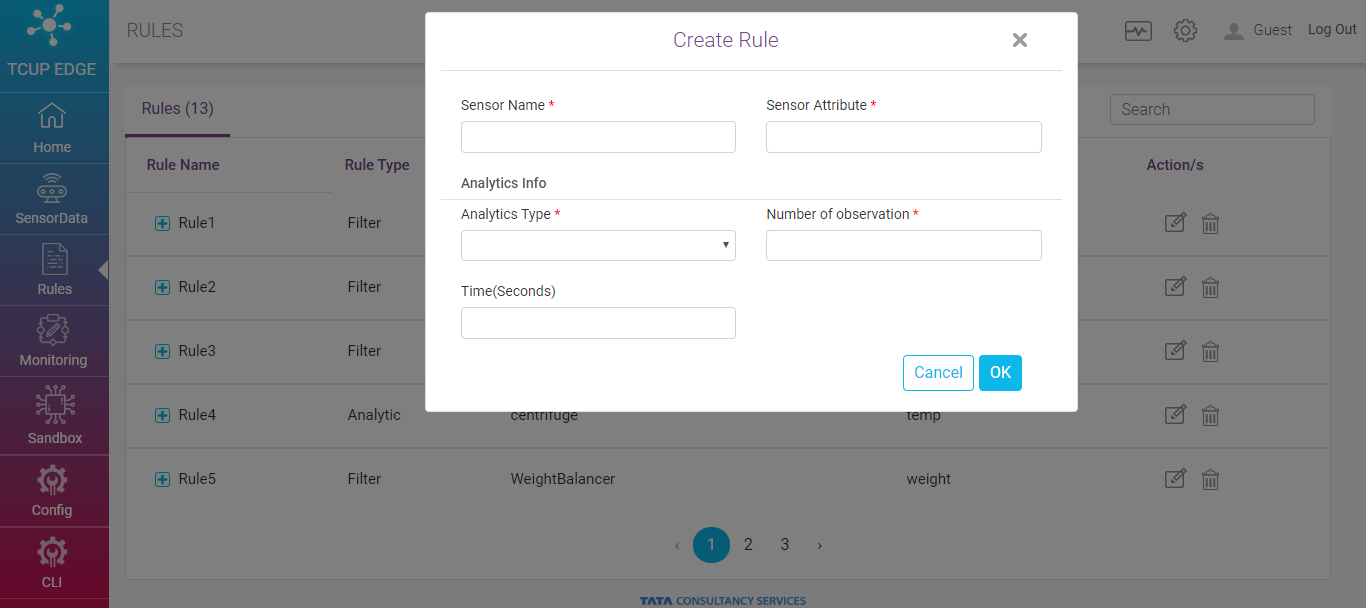
Sensor Name - Specify the name of the sensor against which the rule to be created
Sensor Attribute - Specify the attribute of the sensor
Filter Type - Specify the filter type. Available options are
variance
geometric mean
sigmoid
entropy
harmonic mean
standard deviation
median
range
mean
min
max
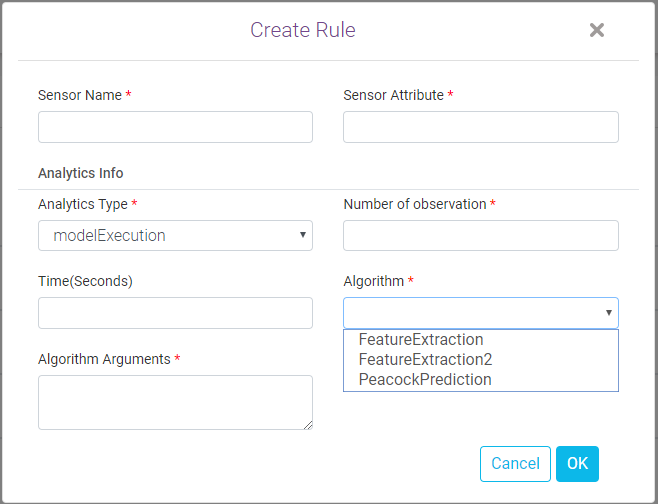
model execution
Number of Observation - Mention number of observation to define batch size.
Time - Mention time in second. It is non mandatory field. If mentioned, acts as ‘logical and’ filter with number of observation e.g. if no. of observation is 4 and time is 60, then the rule will be triggered only if 4 observations arrives within 60 seconds time frame.
Algorithm and algorithm arguments are enabled when analytic type is ‘model execution’.
Message Routing Rule
Message Routing Rule enables data coming on input topic to routes to output topic. On clicking on Message Routing rule following form appears.
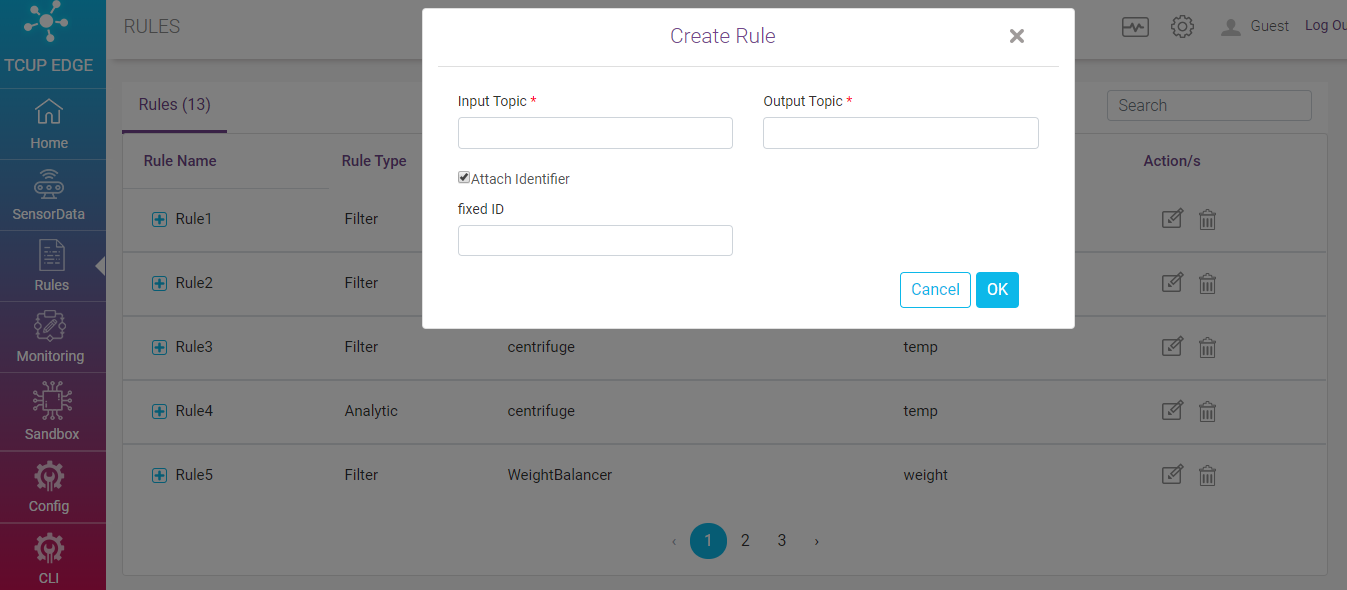
Input Topic - Specify the Input topic
Output Topic - Specify the Output topic
Attach Identifier - When this checkbox is set true and fixed identifier is mentioned then that is attached to messages. If fixed identifier is not mentioned, it will attach some random identifier.
File Based Data
File Based Rules allows user to set rules on data which is to be synchronized using Cloud Synchronization service.
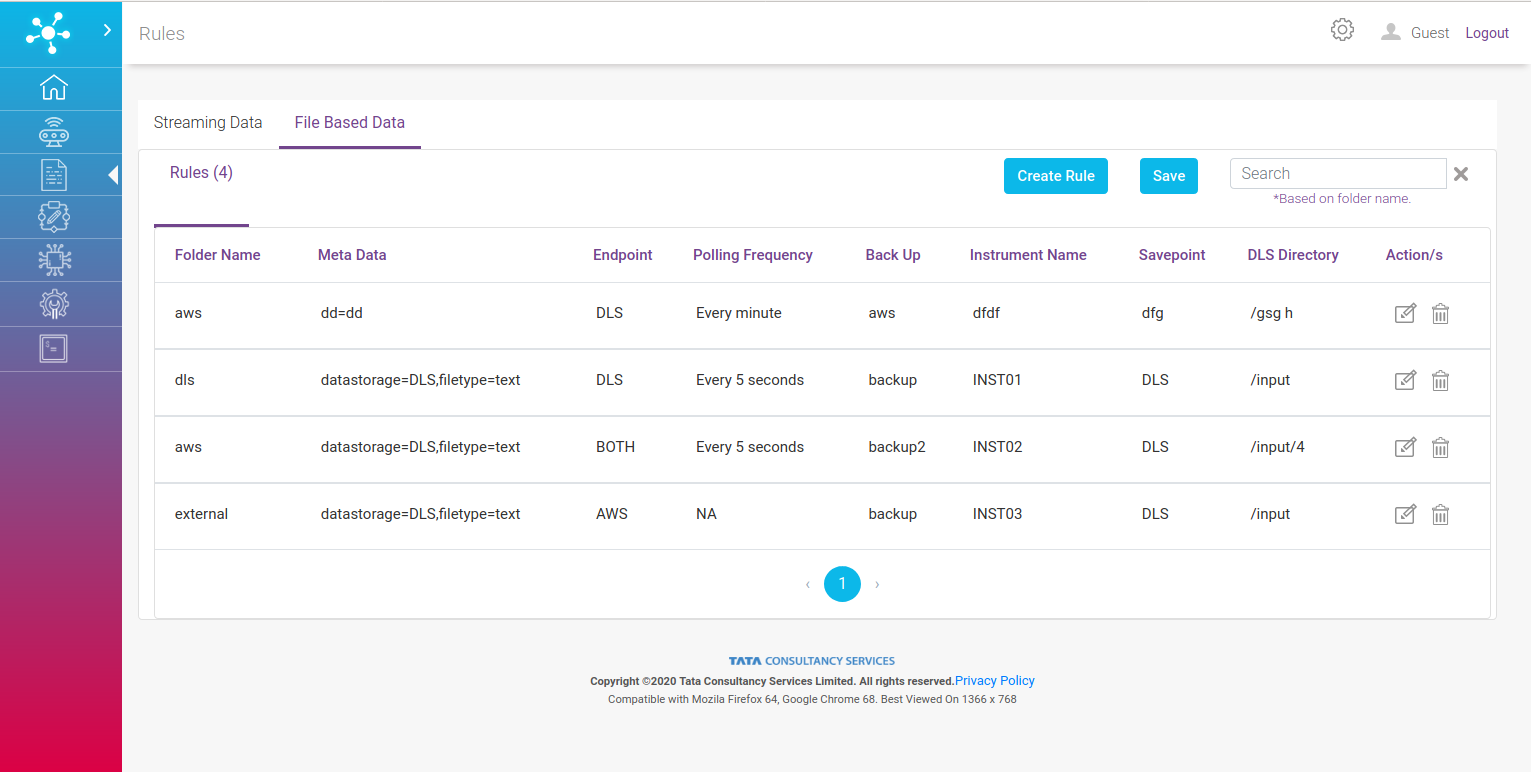
On clicking create rule following screen pops up:
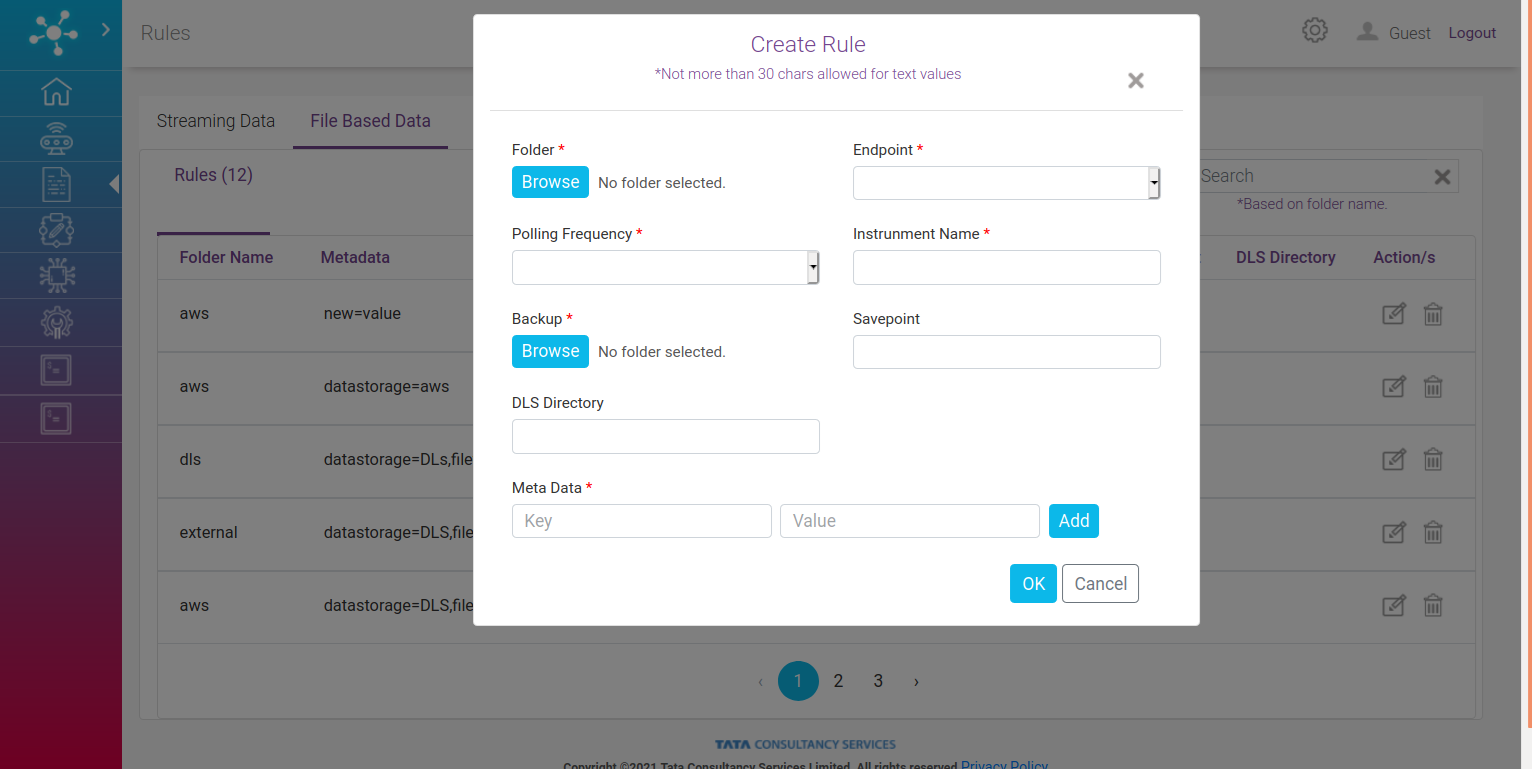
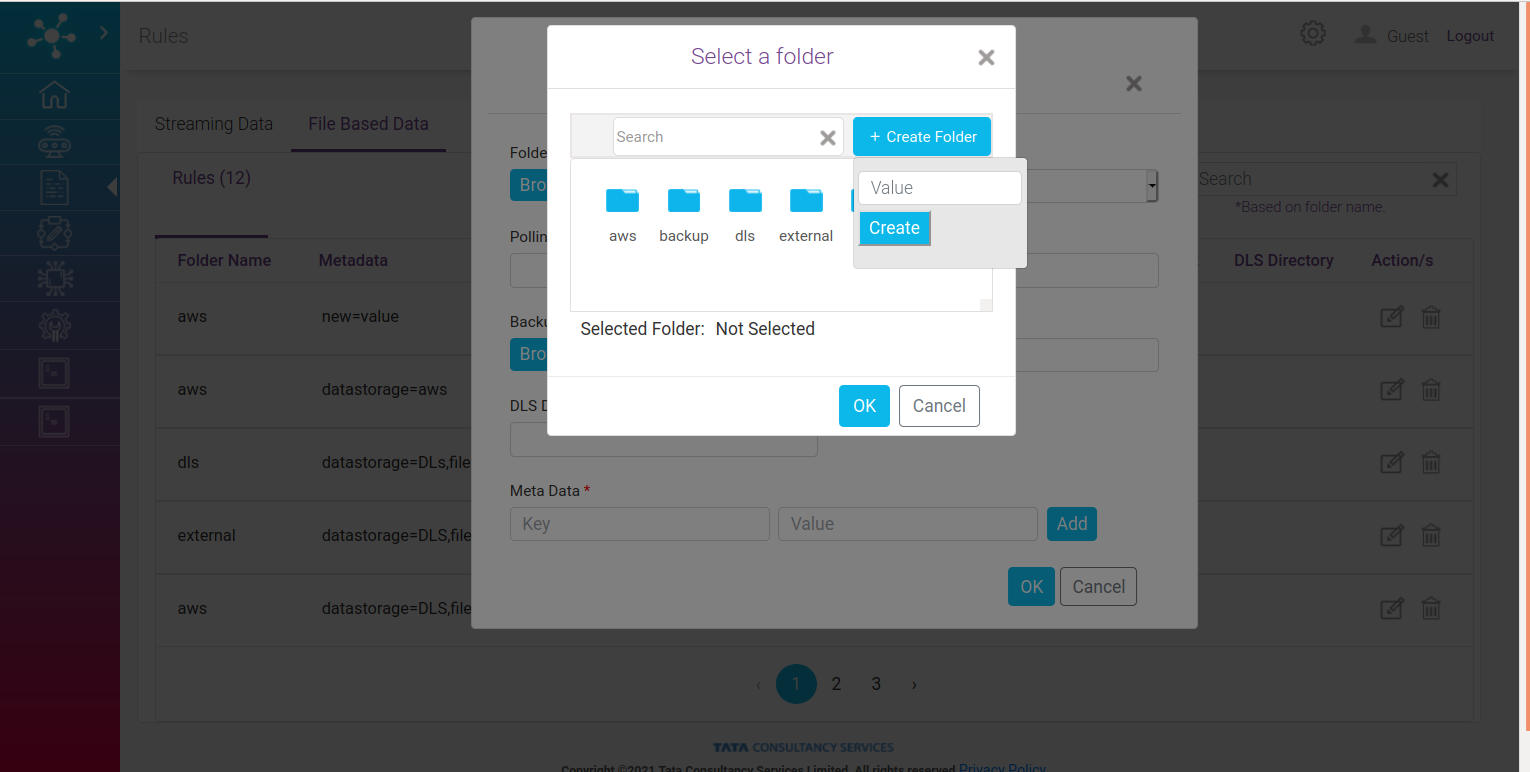
Folder: Folder where data (files) which is to be synchronized resides. On clicking browse following pop up appears. Here a list of folder is shown and if the required folder is missing, option to create the folder is also provided.
Endpoint : Select an endpoint where files will be posted from a dropdown list.
Polling Frequency: Select a frequency at which files will be posted to the endpoint.
Instrument Name: Provide a text here which will be appended to each file’s name.
Backup folder: Provide a folder where files will be kept after successful synchronization.
Savepoint: This is optional, if you want to save your file in DLS (endpoint) on specific savepoint.
DLS Directory: This field is for DLS endpoint. Provide a DLS directory name in this field.
Meta Data: Add key value pair which will be tagged to the files at endpoint. Multiple pairs can be added.
Sensor Data
User can navigate to Sensor Data page by clicking Sensor Data on the left hand side menu.
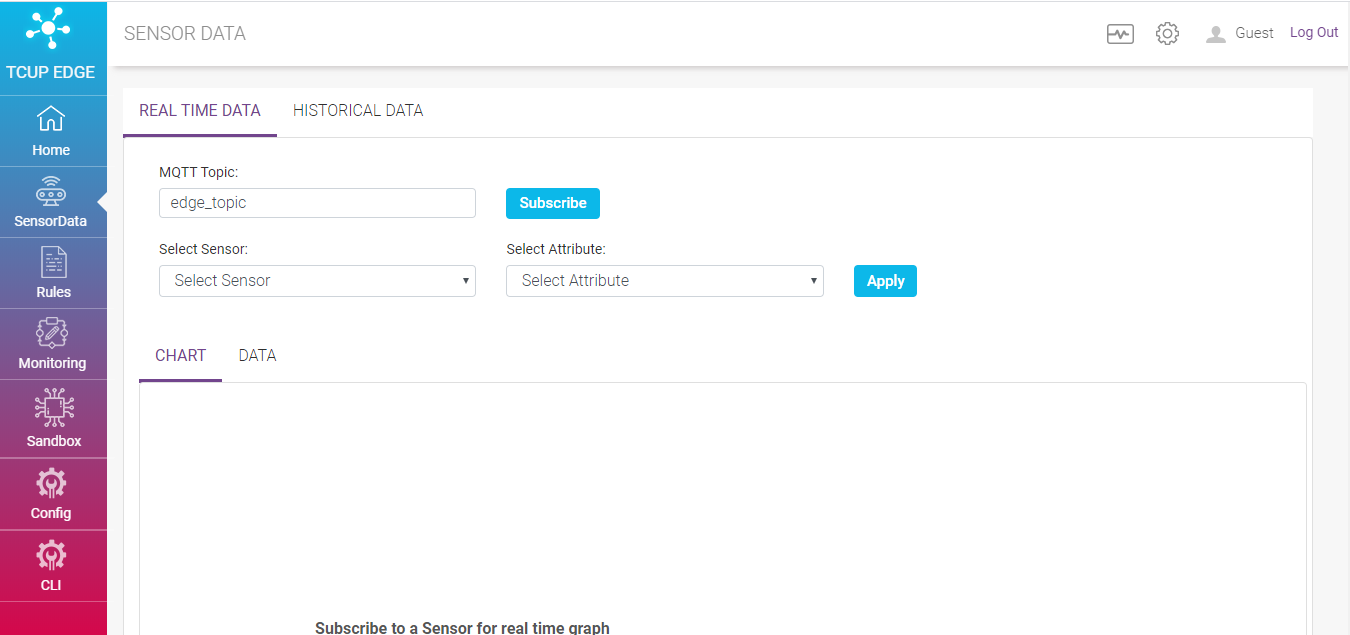
There are two types of sensor data i.e. real time data and historical data. In portal they can be represented as a graph or raw data.
Real Time Data
It establishes connection directly to mosquitto broker running in edge. If ‘send to mqtt broker’ is configured as an action end point in one of the rules, SPRUCE will send output of the rule to mosquitto broker.
To check the real time data user need to specify the following
MQTT Topic - Specify the MQTT topic and subscribe
Select Sensor - Specify sensor name based on which data for visualization is filtered
Select Attribute - Specify the attribute of the selected sensor to filter data based on attribute and click apply
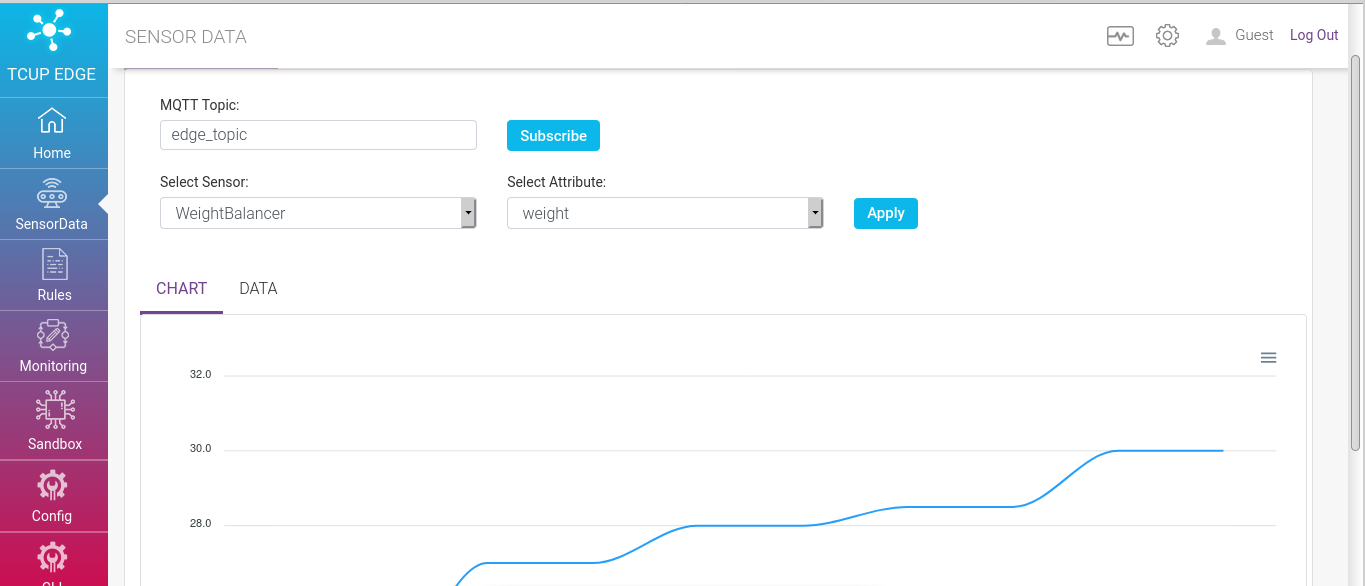
The data can be visualized as graph under ‘CHART’ tab and can be viewed in tabularized format under ‘DATA’ tab, based on the Topic and applied filter. Also a download as CSV option is available to download the raw data.
Historical Data
All the data ingested in gateway can reside locally in local data repository through a service component called Sensor Observation Service Lite(SOS Lite). This service is available as RESTFUL Web APIs.
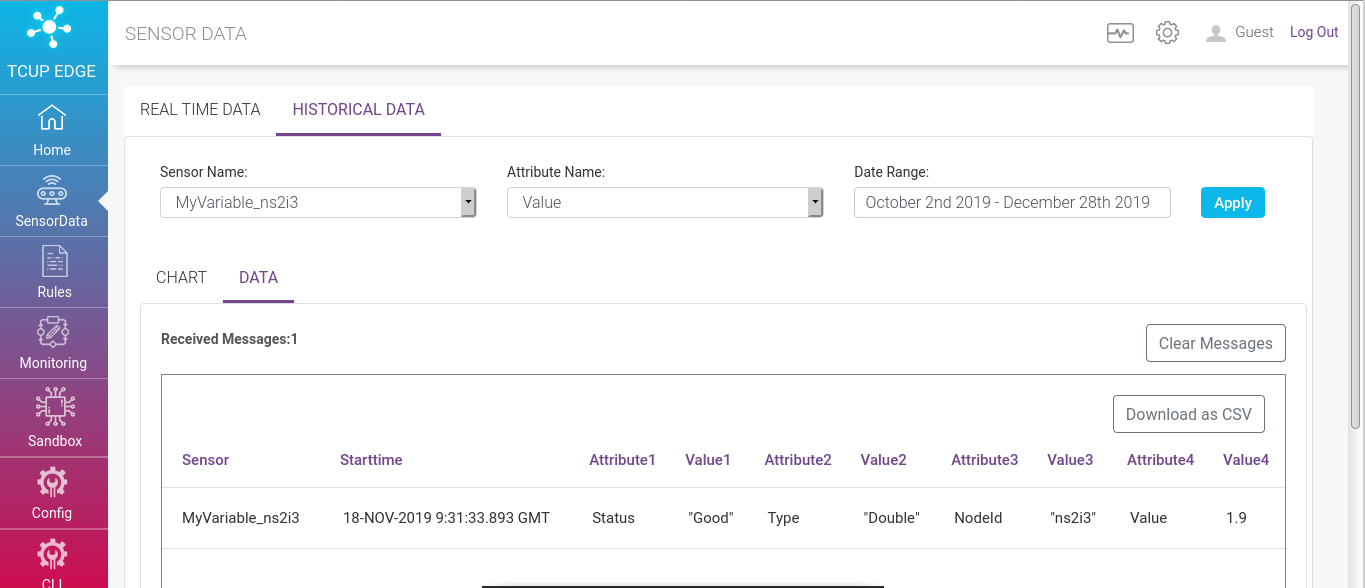
Historical data is fetched using these RESTFUL Web APIs. The data can be visualized as graph under ‘CHART’ tab and can be viewed in tabularized format under ‘DATA’ tab. Also a download as CSV option is available to download the raw data.
To check the historical data user need to specify the following
Select Sensor - Specify sensor name based on which data for visualization is filtered
Select Attribute - Specify the attribute of the selected sensor to filter data based on attribute.
Date Range - Mention date range to fetch data within a time frame.
Monitoring
To navigate to Monitoring page click Monitoring on the left hand side menu.
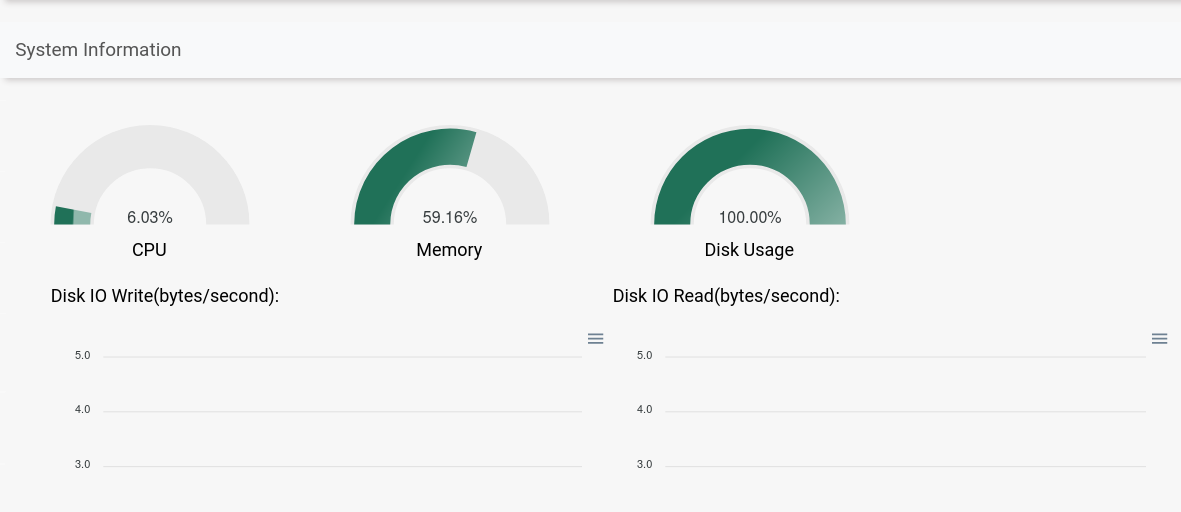
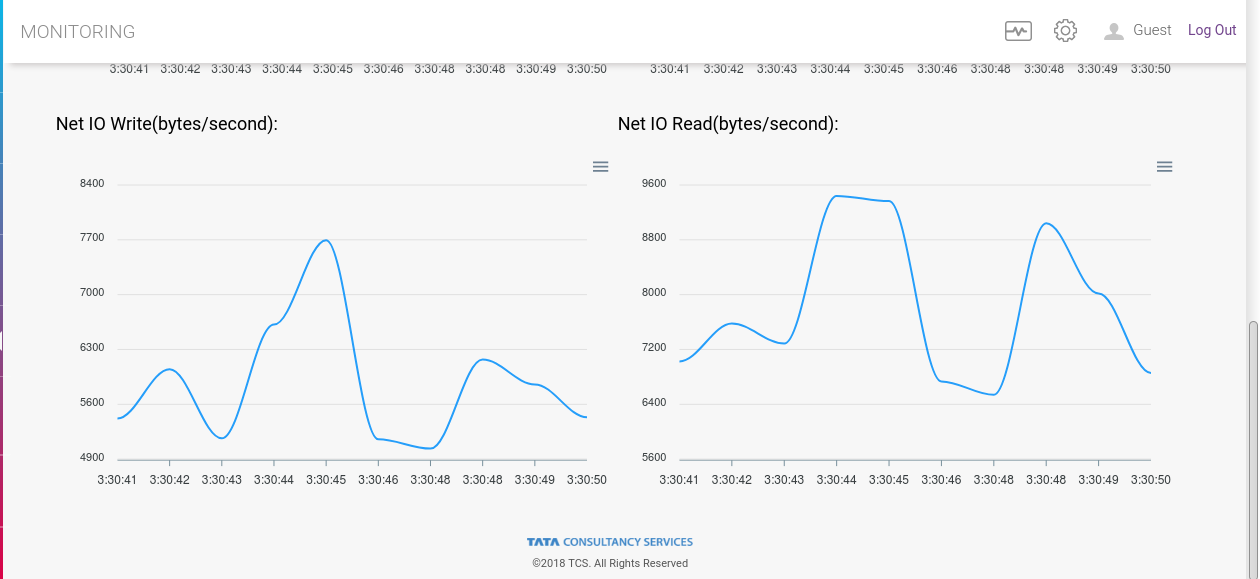
TCUP Edge components can be deployed as both containers and non-container mode. However the monitoring of these components is vital to ensure smooth functioning of the program. There is a monitoring agent running in the background which captures the real time health status of not just the edge box but also of all the service components deployed on the edge box. These statistics can be viewed on ‘Monitoring Page’.
Sandbox
To navigate to Sandbox page click Sandbox on the left hand side menu.
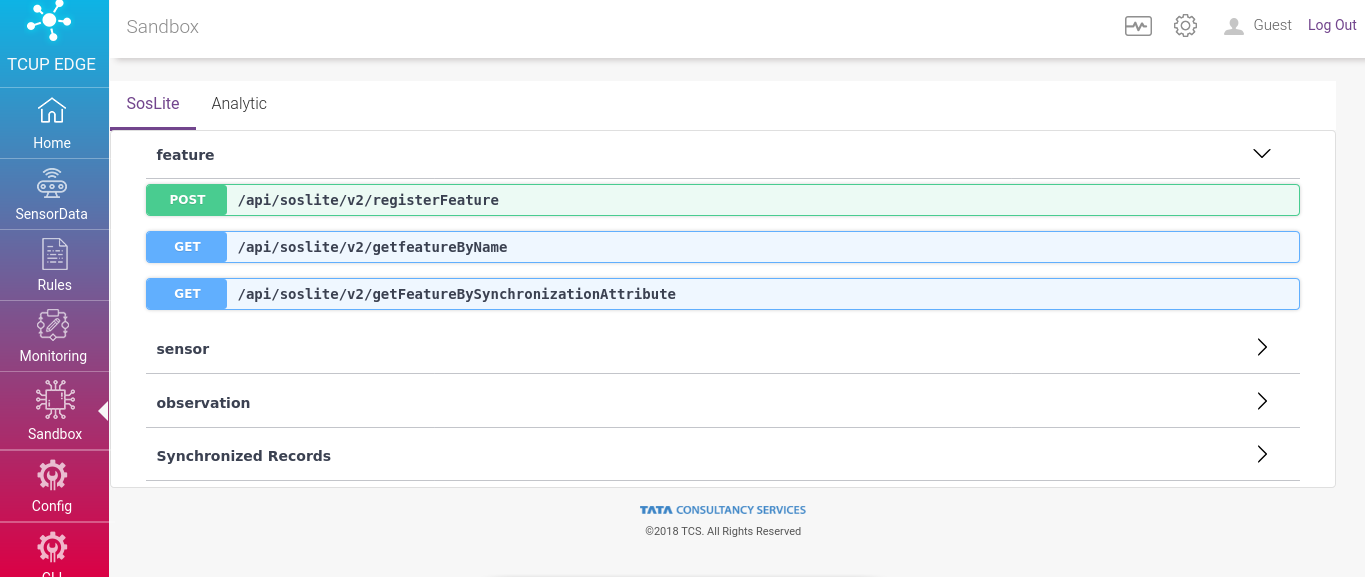
In Edge portal Sensor Observation Service(SOS Lite) and Analytics is available as RESTFUL Web APIs. Sandbox helps developers to design, build, document, and consume RESTful web services.
This page allows connections directly to live APIs through its interactive, HTML-based user interface. Requests can be made directly from the UI. SOSLite APIs are available under SOSLite tab and analytics under analytic tab.
To know the details of each API please refer the Edge API guide.
Configuration
To navigate to configuration page click Config on the left hand side menu.
Configuration page allows following components to configure through configuration page.
SPRUCE
Cloud Synchronization
SOS Data Truncator
Log Management
Certificate Configurations
SPRUCE
SPRUCE (Stream Processing over Rule-Based Computing Engine) is used for executing real time filters and analytics on top of observation data. It can be configured through a set of rules and is also capable of executing inbuilt actions and custom models on top of batched real time data.
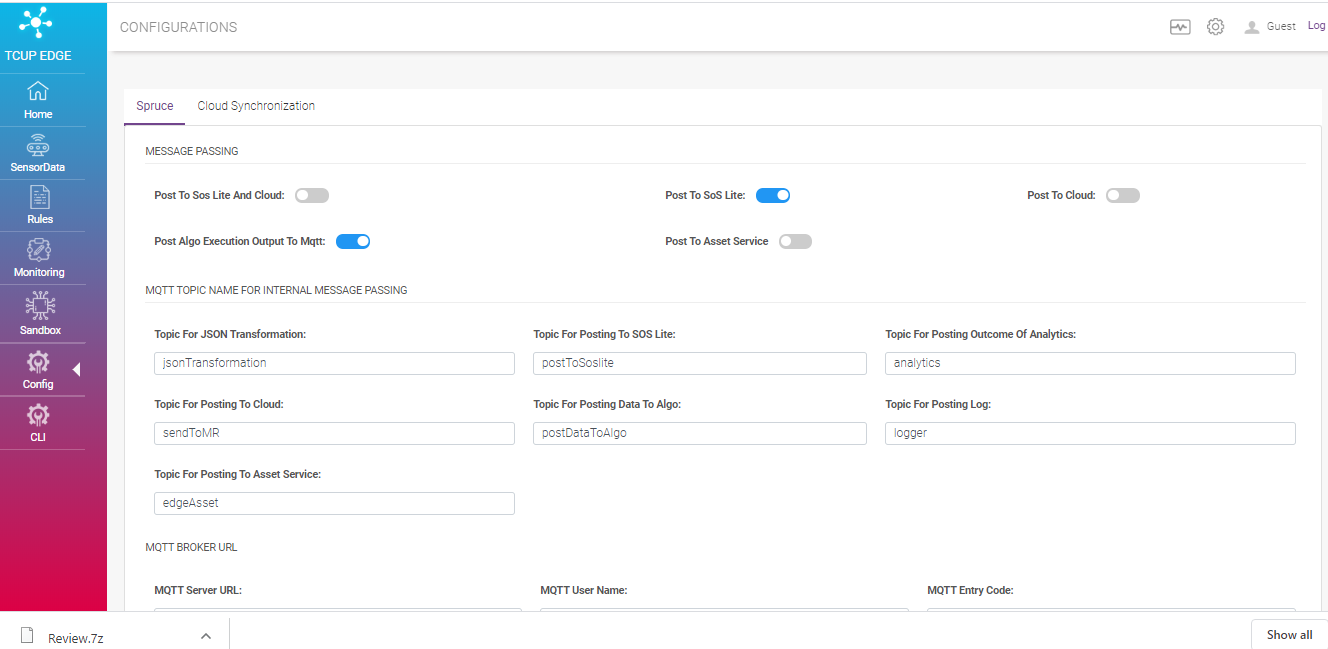
Following are the different configurations for SPRUCE
Message Passing
MQTT Topic Name for Internal Message Passing
MQTT BROKER
Proxy Configurations for Edge Component
Asset Service Configurations
TCUP Instance
SOS Lite
Other Configuration
Cloud Synchronization
Cloud Synchronization synchronizes locally saved observations to the cloud. It enables features like:
External file upload feature to AWS S3
External file upload feature to TCUP Data Lake Service (DLS)
Sensor data conversion to parquet file format and inturn uploading it to DLS
Sensor data conversion to csv file format and inturn uploading it to DLS
File Archival & Rotation Feature for External File upload in DLS.
All the parameters pertaining to above features are configurable under Cloud Synchronization tab.
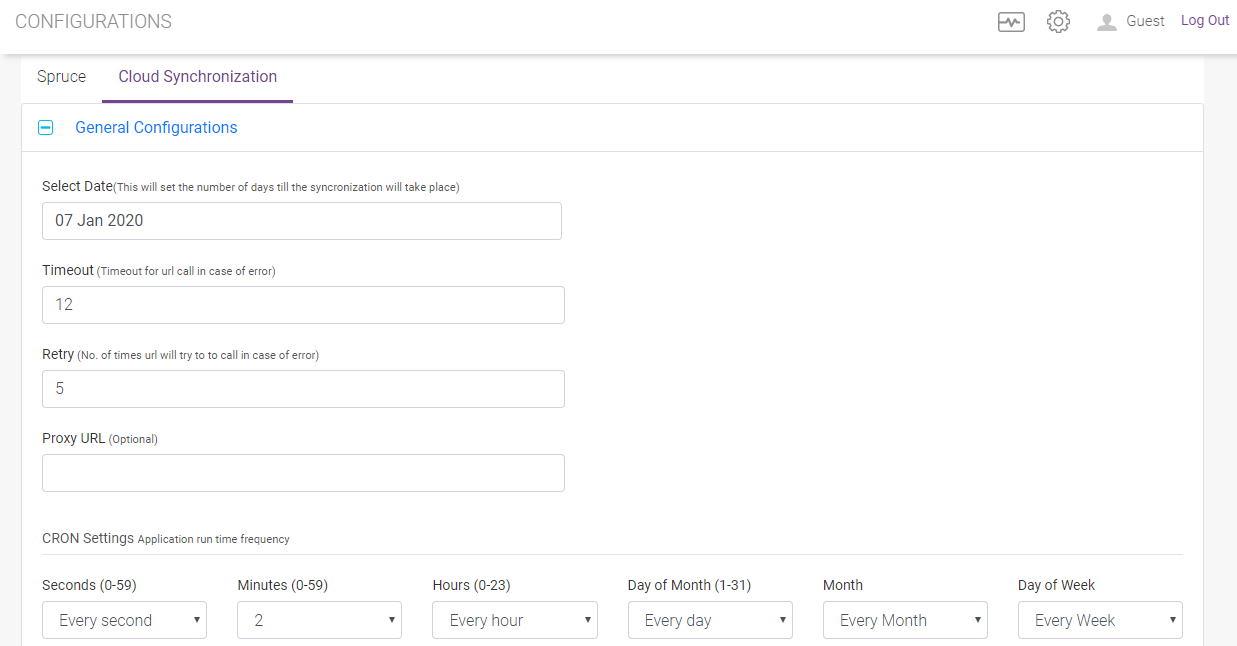
General Configuration
This section has the general configurations for cloud synchronization. Please refer the screen shot below. All the fields are self-explanatory
Storage Configuration
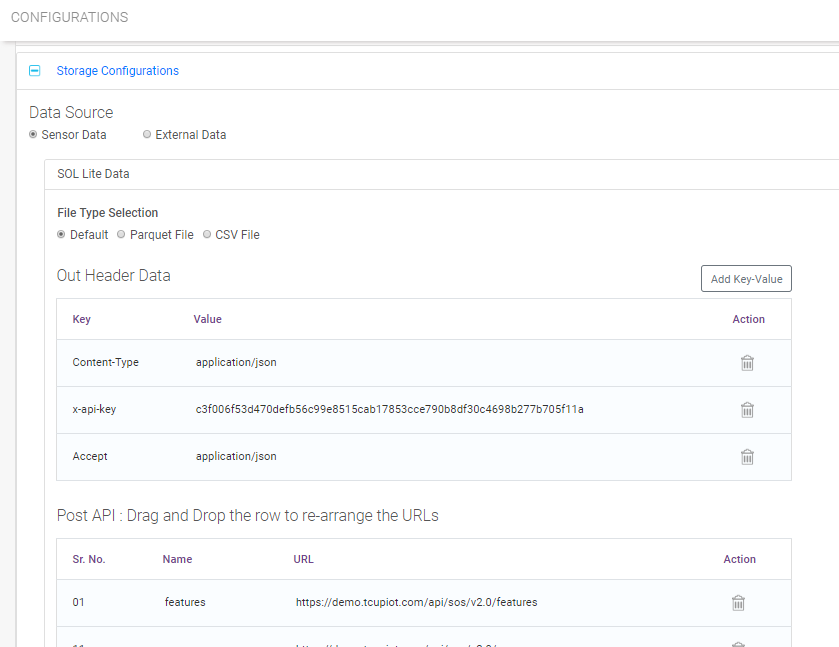
Storage Configuration section defines connection configuration to Cloud Computing Platform and configuration for files/data to be synchronized. Based on the requirement configuration can be of 2 types. Configuration for
Sensor Observation Service
External Destination
For Sensor Observation Service user need to mention the following
file format in which observations will be synchronized
Request header details as key value pair
URLs for POST API.
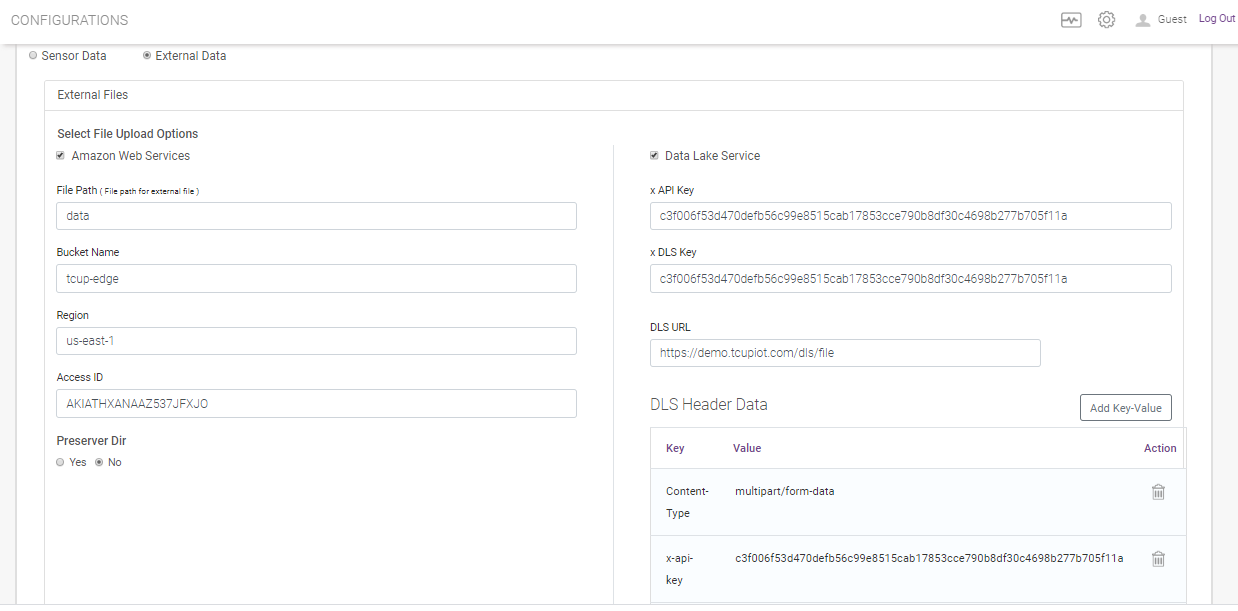
External file upload option can either to Amazon Web Service and/or to Data Lake Service.
For Amazon Web Service user need to mention the following
File Path
Bucket Name
Region
Access Id
if want to Preserve Directory
For DataLake Service following are to be specified
API Key
DLS Key
DLS URL
DLS Header data as key value pair
External meta data as key value pair
SOS Data Truncator
Once the synchronization of records is successfully carried out records are periodically deleted from the file system through SOS Lite Data Truncator (SDT).
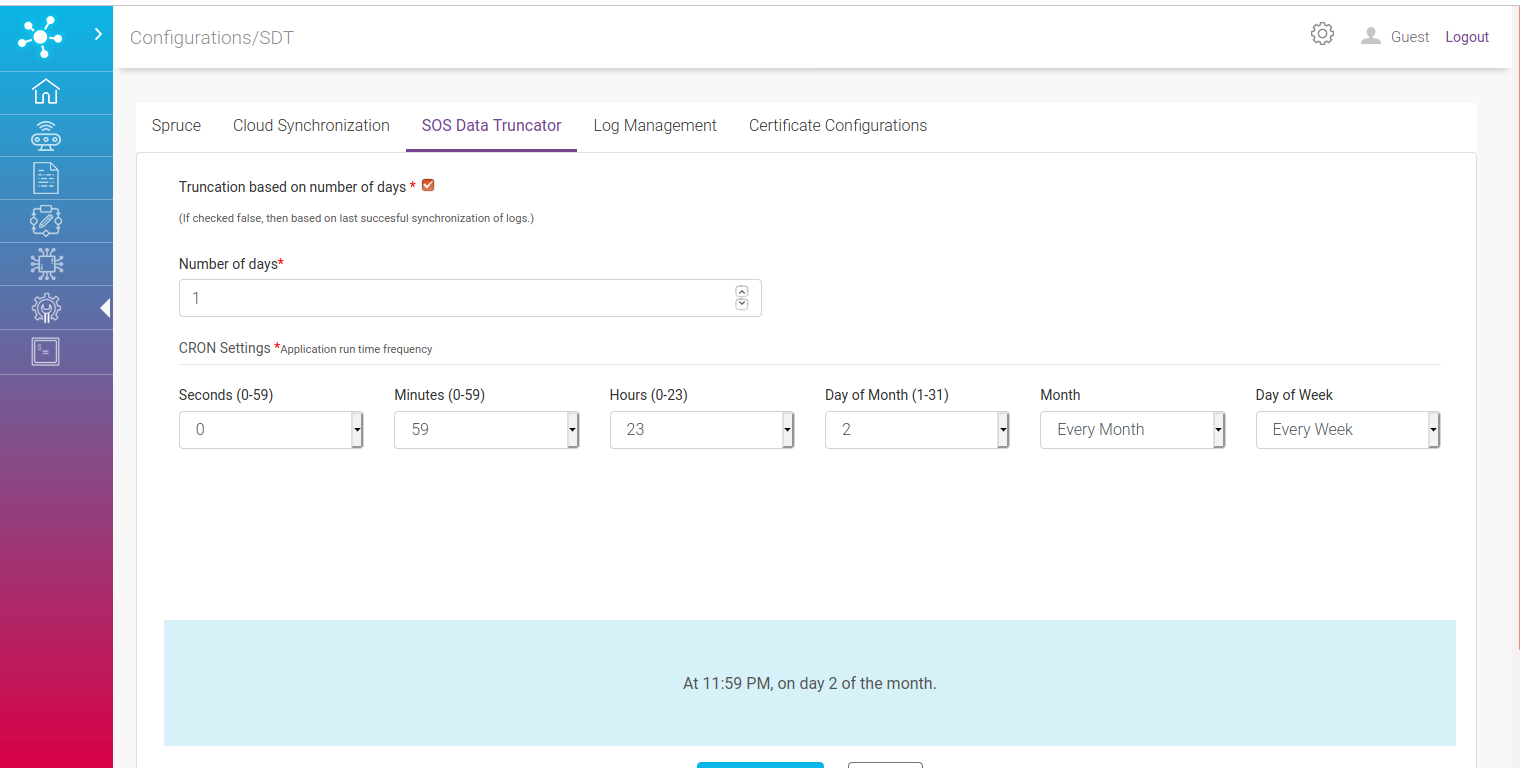
Configuration involves:
Truncation based on number of days: If checked true, then another option where number of days gets enabled for entry which means truncation happens based on specific time period of data from now. If checked false, then truncation happens based on last successful synchronization of logs.
Number of days: Provide integer value if above field is checked true.
CRON settings: Frequency at which SDT runs.
Log Management
This component getting all the application log of edge components and do the log archival and truncation on it.
Features:
Capability to read all the application logs for each and every edge modules/components and kept in a user configured path
Logs are compressed (.tar.gz)
Logs can be archived and stored in TCUP Data Lake Service (DLS)
Logs can be truncated periodically
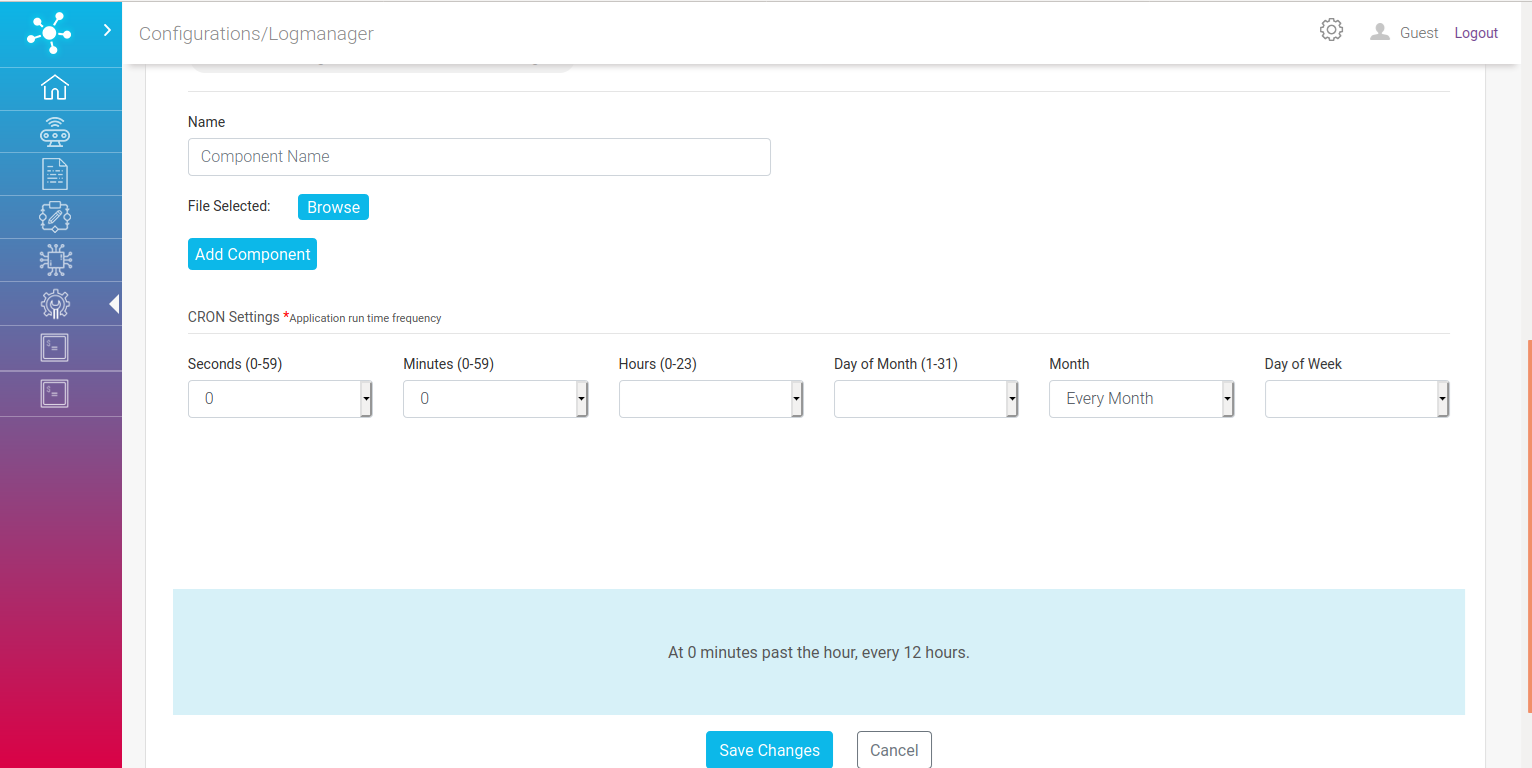
Complete process can be scheduled in CRON
Please refer to the screen shot below. All the fields are self-explanatory
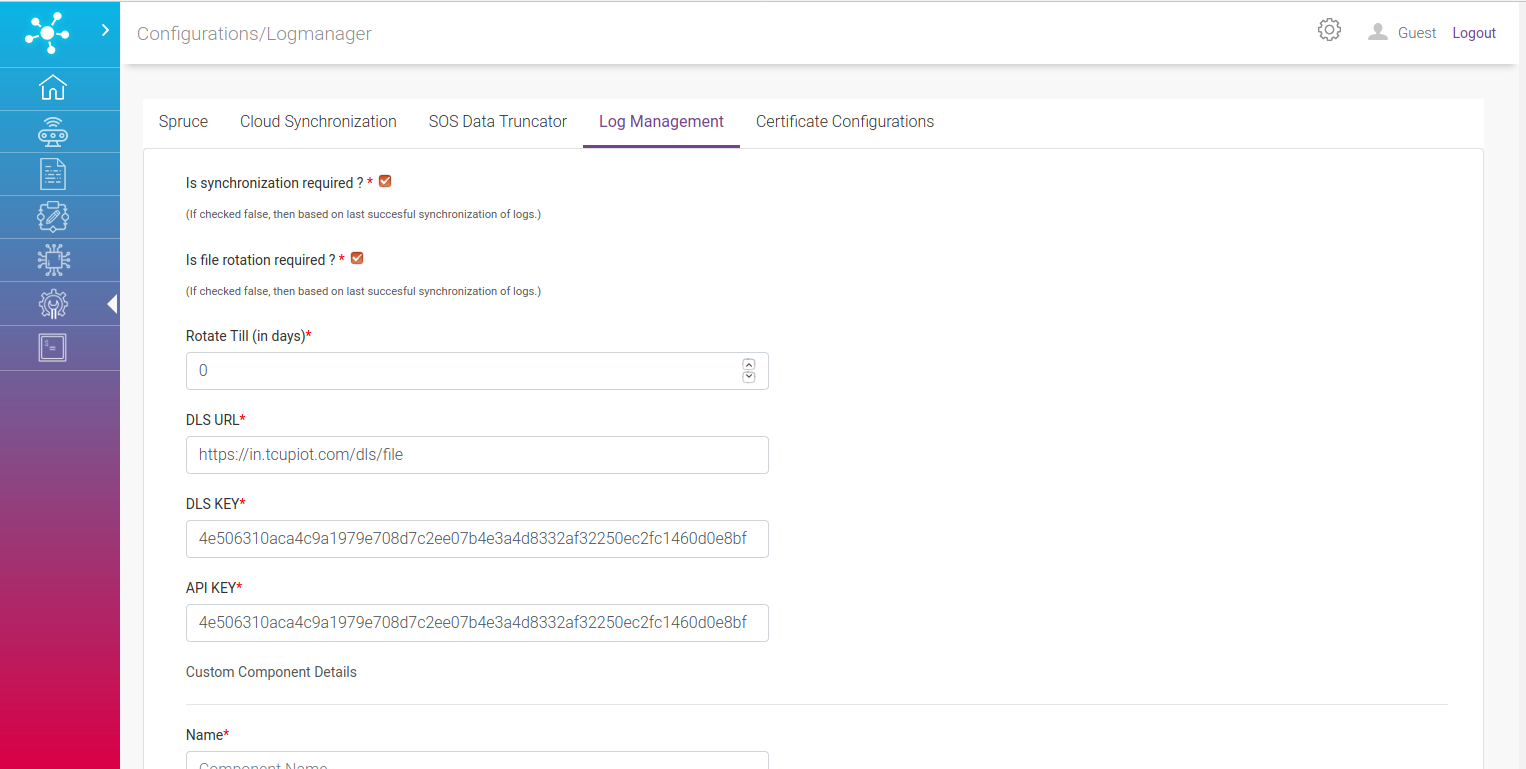
One can also add custom components for log monitoring. Just add name of the component and browse select its log file.
Certificate Configuration
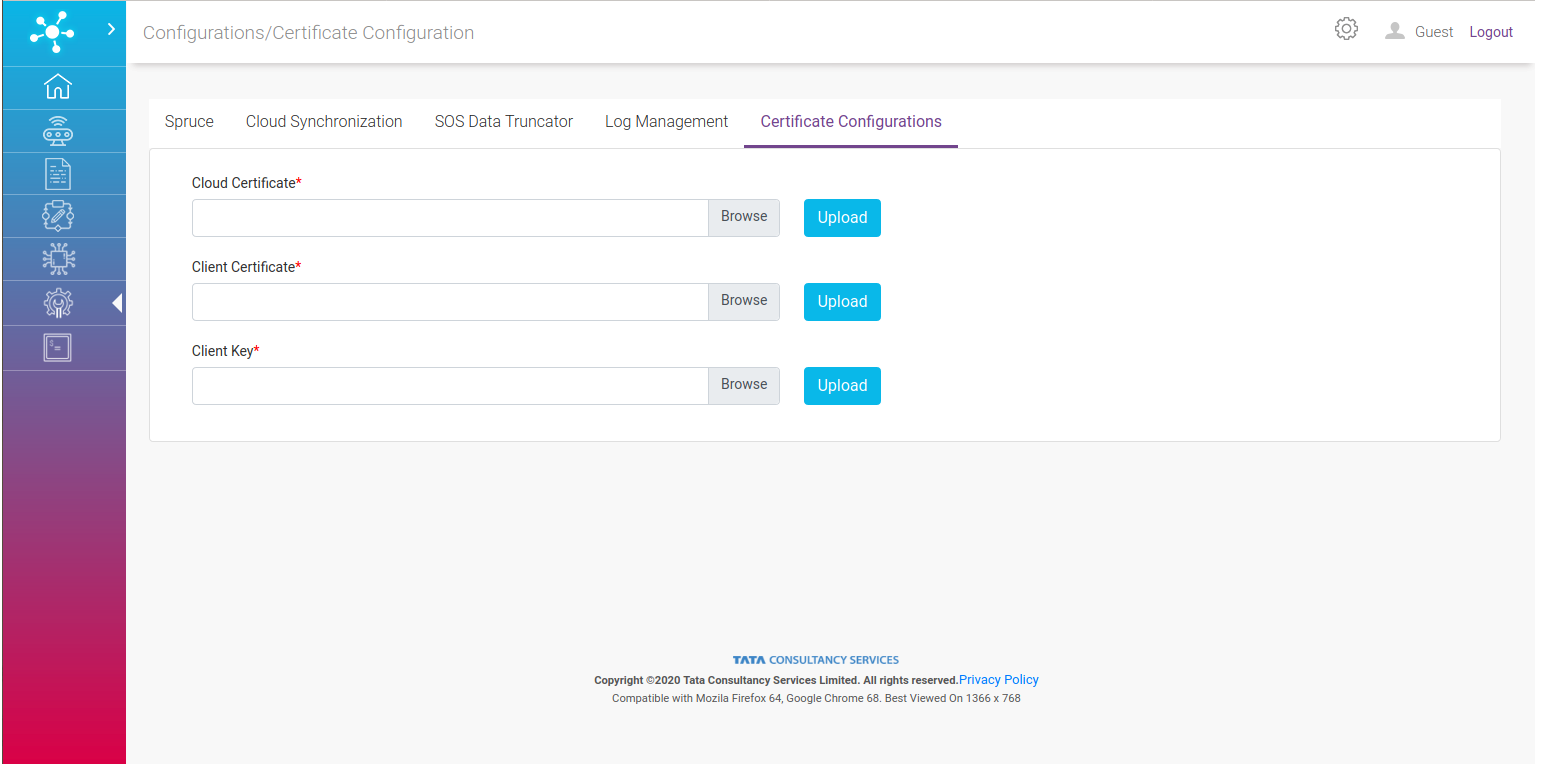
Certificate Configuration is used for globally updating certificates across TCUP Edge platform.
In this screen, three types of certificates can be updated.
Cloud Certificate: This is TCUP Cloud certificate. Internal service use this certificate to connect to TCUP Cloud.
Device Certificate & Key: These are used for device connectivity with cloud.
Console
To navigate to console page click CLI on the left hand side menu.
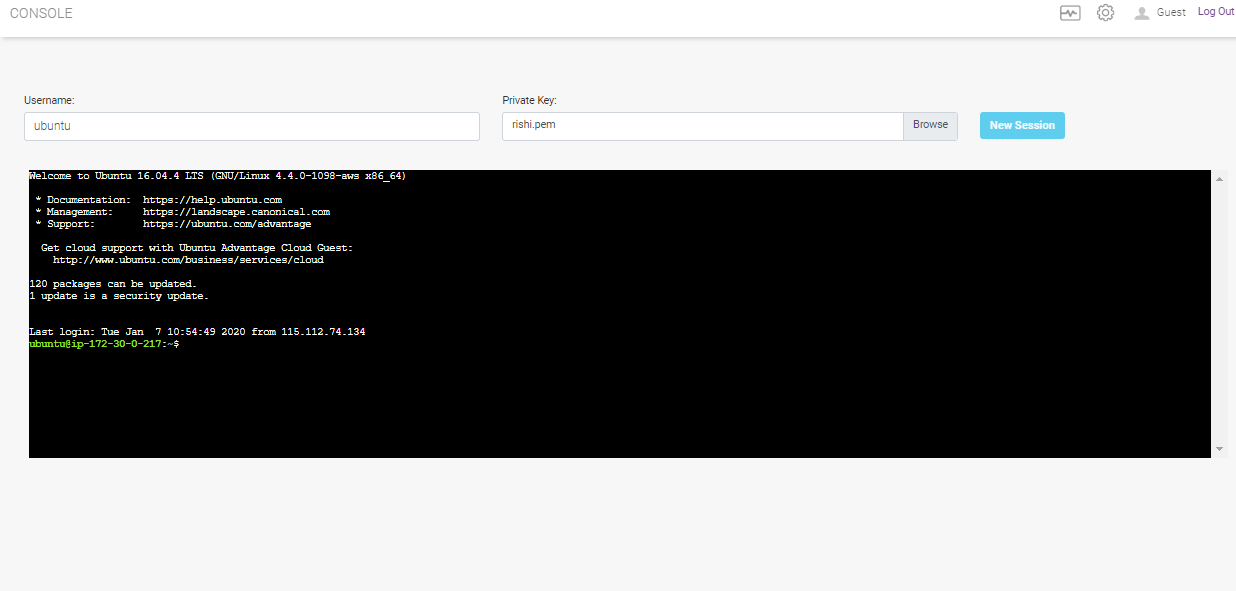
This screen provides capability for remote logging into the Edge Box for health check or debugging purposes. User need to provide Username and Private Key to establish connection to the Edge Box.
Calculation Manager
To navigate to calculation manager screens click Calculation Manager on the left hand side menu.
These screens facilitates managing calculation rules, logs, and visulization of calculation output and input tags.
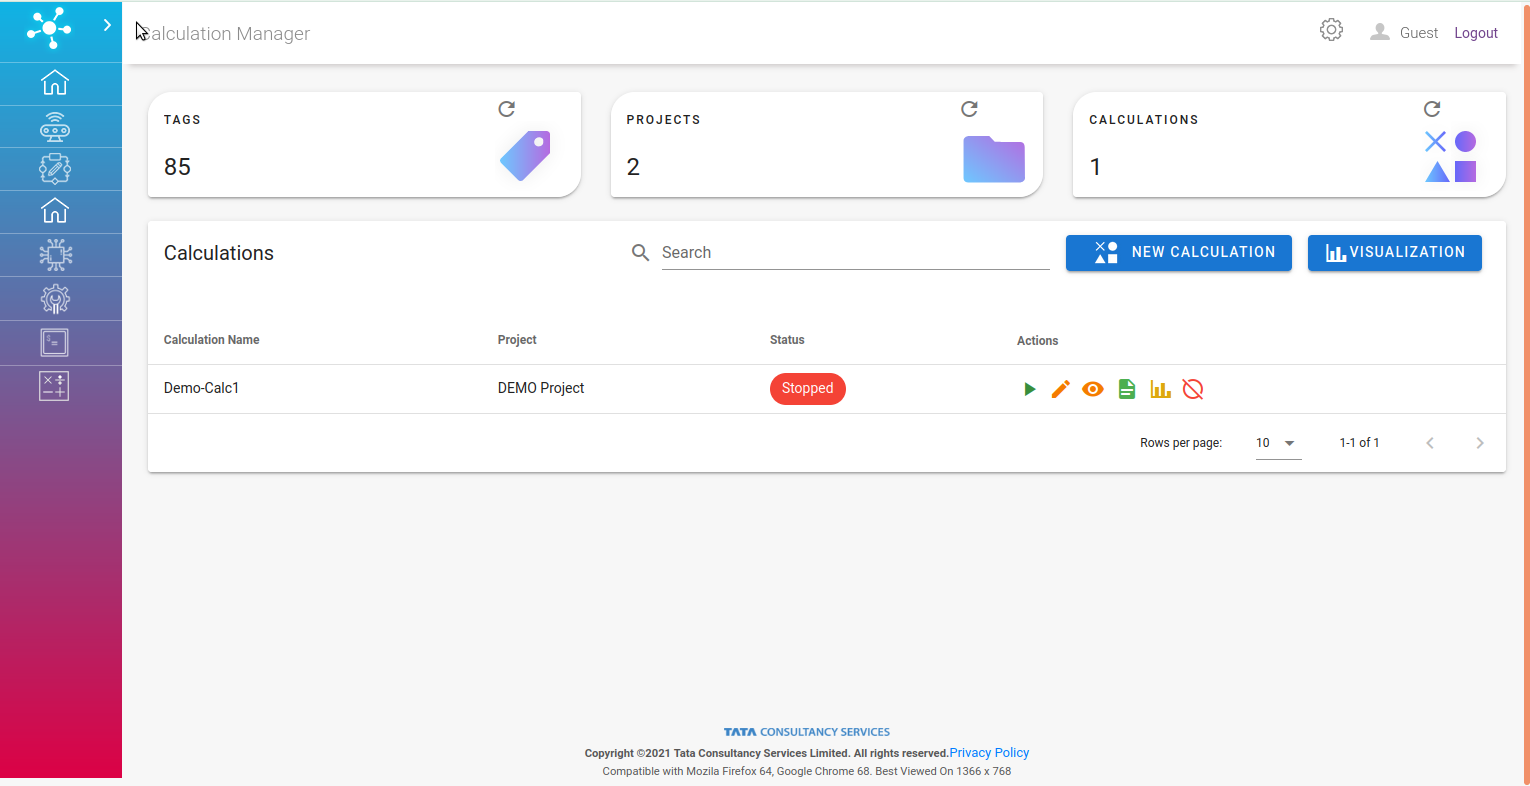
On the dashboard page of calculation engine an overall view of calculation is visible:
A list of user defined calculations within a project,
Number of available tags, projects, calculations.
Create new calculation button, and
Visualize the calculation output.

For each calculation in the list multiple access controls are provided as listed below: 1. Start/ Stop Calculation, 2. View the calculation configuration,
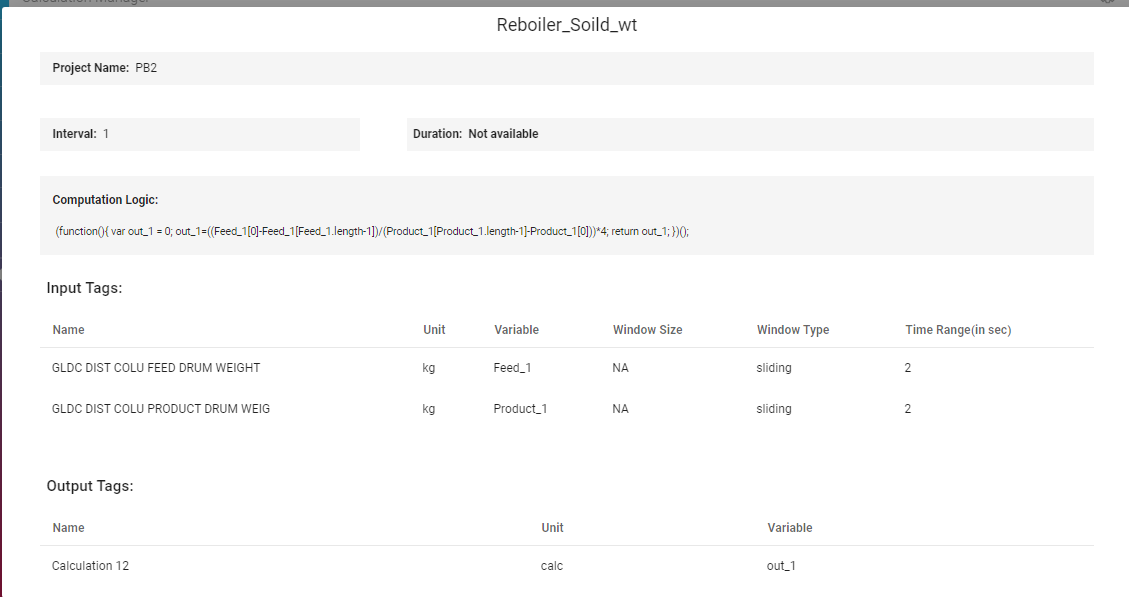
Access calculation Error Log,
Visualize the calculation output,
Disable calculation
Create New Calculation
First page of the form conatins:
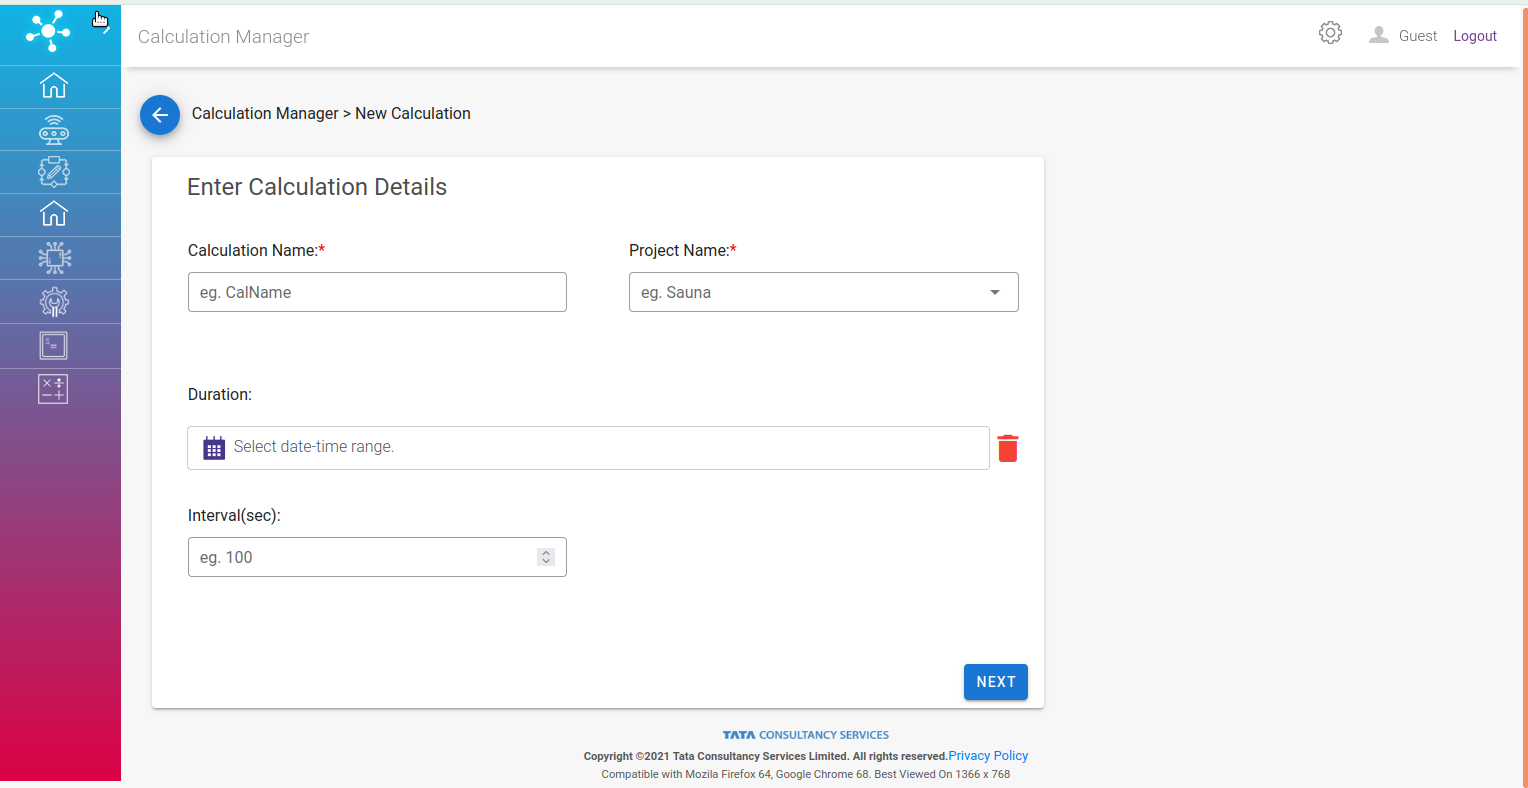
Calculation name (required): This field only accepts alphanumeric(spaces, dash, underscore, min-3 & max-30 charaters) values.
Project (required): Select a project from dropdown.
Duration (optional): This field signifies duration over which calculation would be valid.
Interval (optional): This field allows calculation to run on pre-defined interval.
Second page of the form conatins:
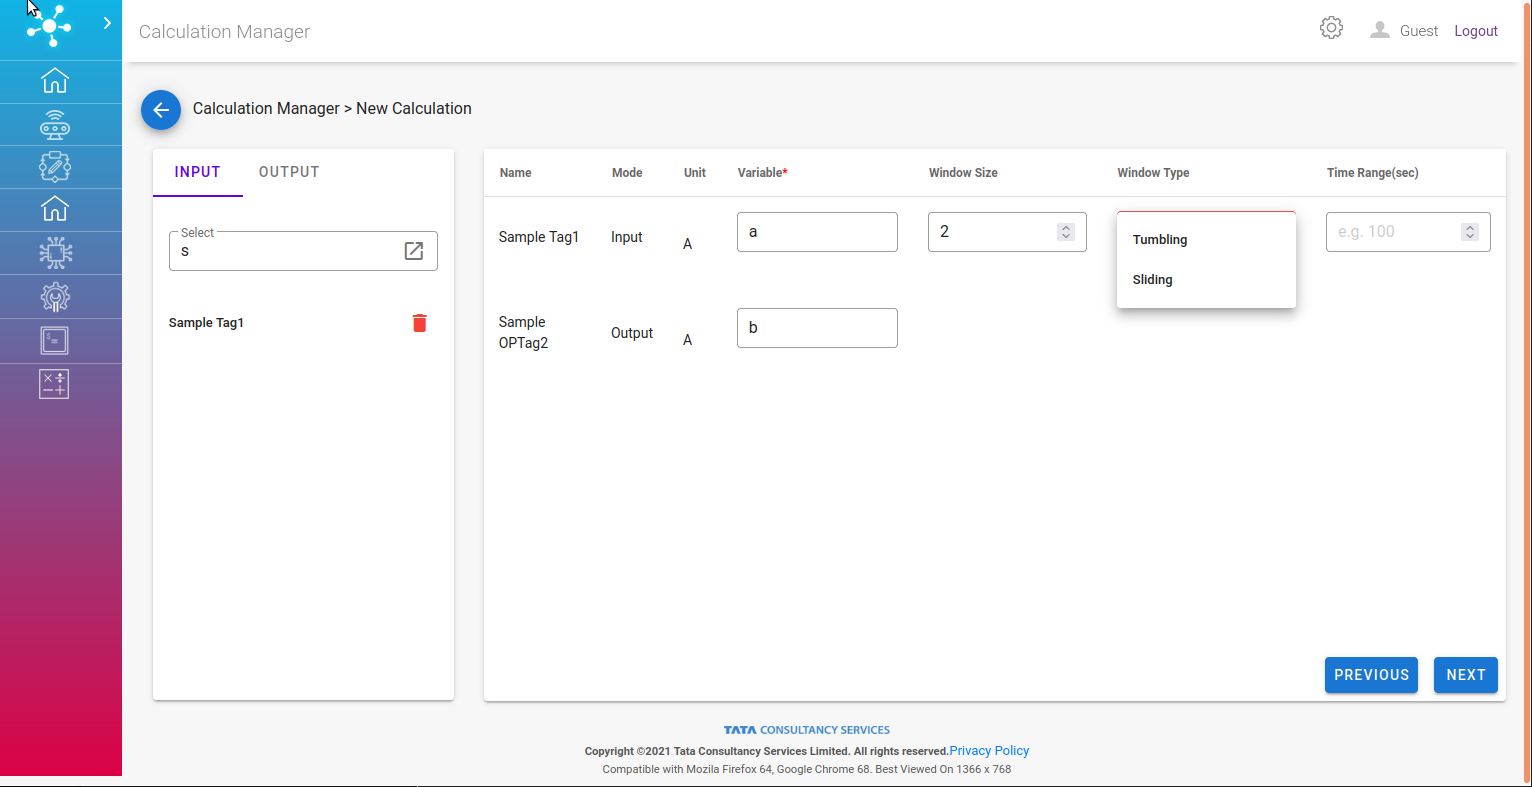
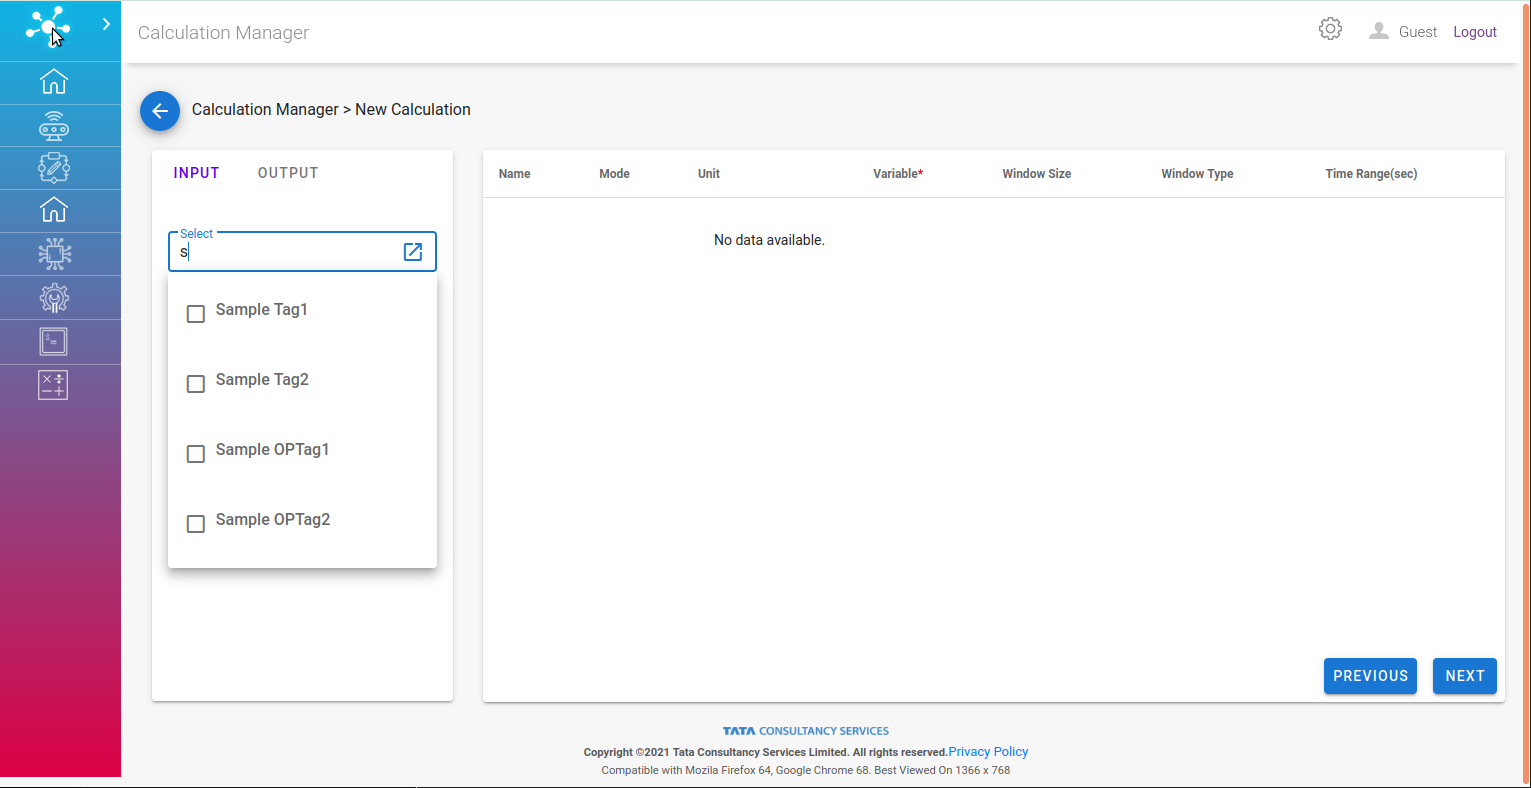
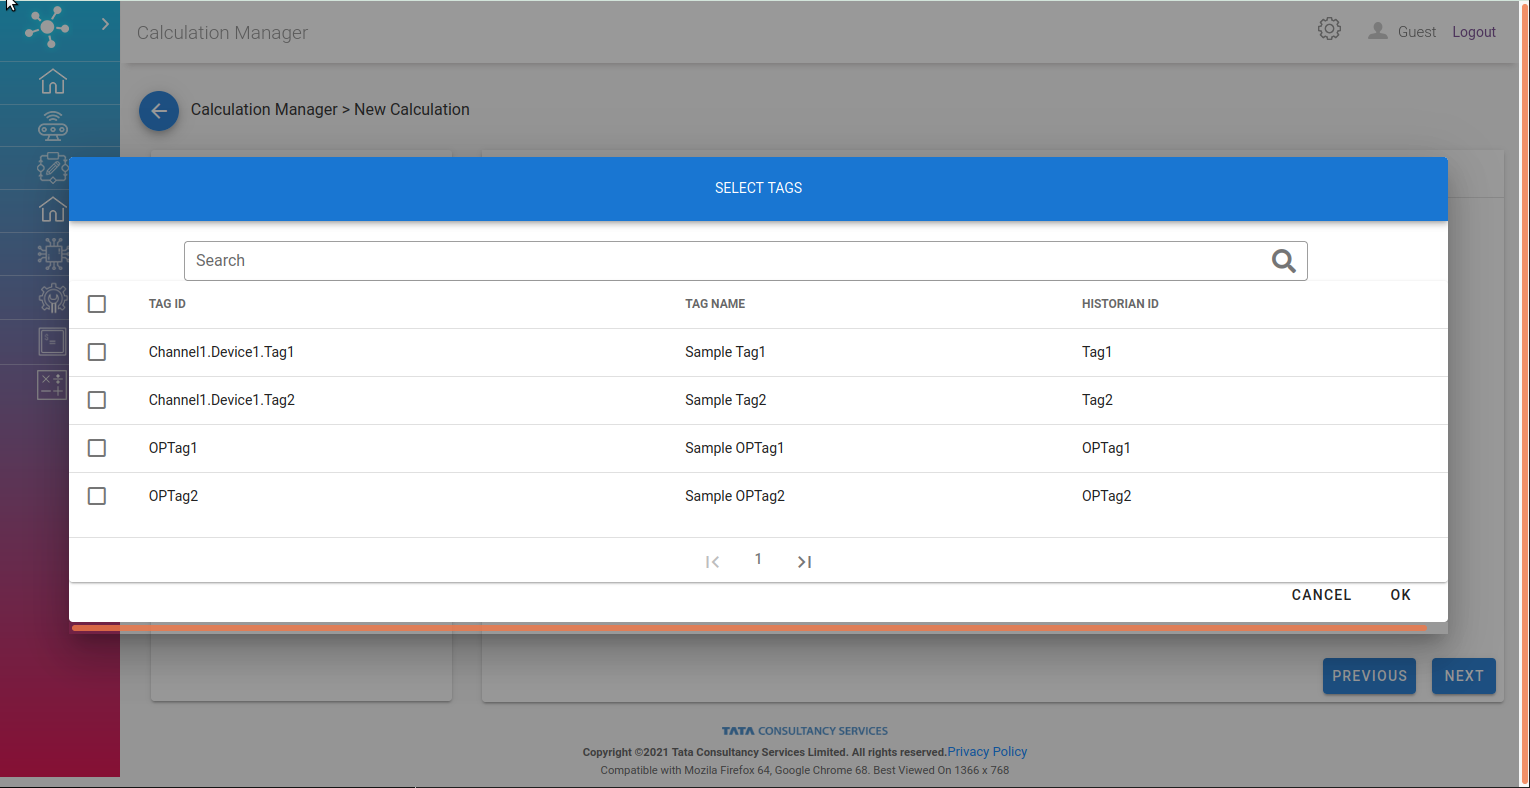
Input and Output search tab gives latest 5 tags with the search keyword, this could be expanded for wider a search.
Variable: Valid for Input and Output tag both, should be a unique identifier.
Window Size: Valid for Input tag, This field defines number of data points for each of the input tag to be considered for the computation.
Window Type: Valid for Input tag, There are two drop down options under Window Type. First is “Sliding Window” and another is “Tumbling Window”.
Time Range: Valid for Input tag, This field defines the interval in minutes for data accumulation.
Third Page of the form contains:
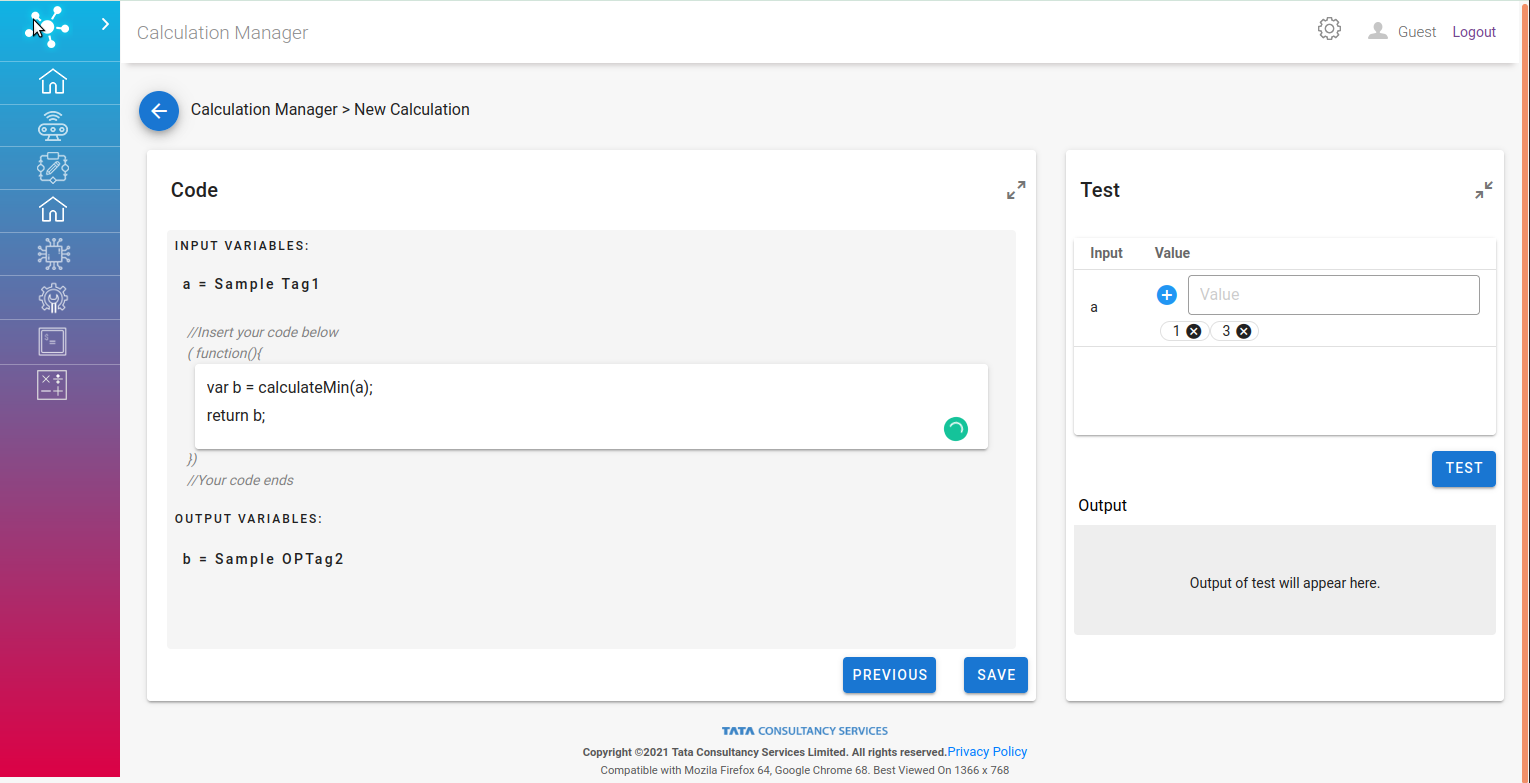
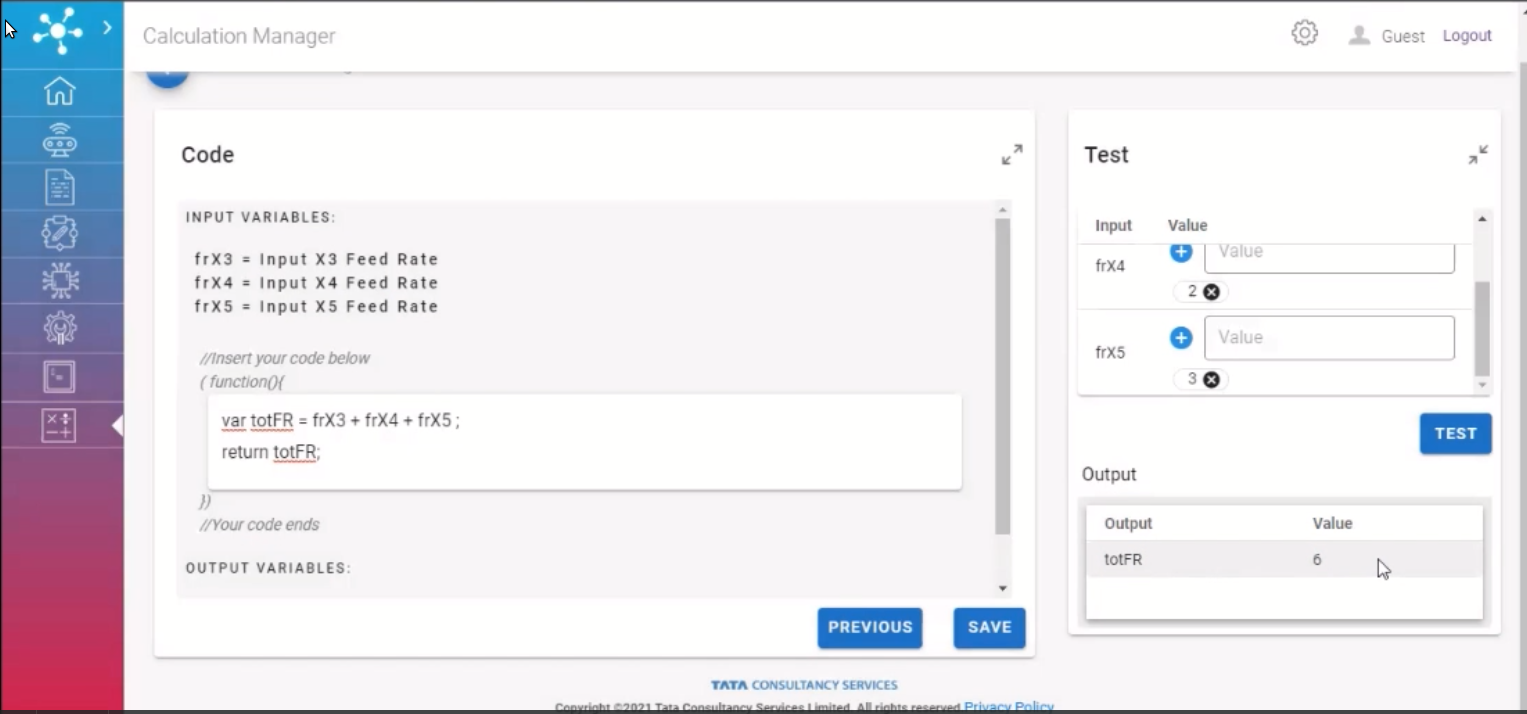
Code: A block to define custom computational logic. There are some out of the box functions such as:
calculateMin e.g. calculateMin([1,3]) –> 1.
calculateMax
calculateMean
calculateMedian
calculateMode
calculateStdDev
calculateSigmoid
calculateGeometricMean
calculateHamronicMean
Test: A manual testing block with sample values to evaluate the logic.
Edit Calculation
All the details below would be pre-filled.
First page of the form conatins: 1. Calculation name (required): This field only accepts alphanumeric(spaces, dash, underscore, min-3 & max-30 charaters) values. 2. Project (required): Select a project from dropdown. 3. Duration (optional): This field signifies duration over which calculation would be valid. 4. Interval (optional): This field allows calculation to run on pre-defined interval.
Second page of the form conatins: 1. Input and Output search tab gives latest 5 tags with the search keyword, this could be expanded for wider a search. 2. Variable: Valid for Input and Output tag both, should be a unique identifier. 3. Window Size: Valid for Input tag, This field defines number of data points for each of the input tag to be considered for the computation. 4. Window Type: Valid for Input tag, There are two drop down options under Window Type. First is “Sliding Window” and another is “Tumbling Window”. 5. Time Range: Valid for Input tag, This field defines the interval in minutes for data accumulation.
Third Page of the form contains:
Code: A block to define custom computational logic. Previously saved code can be copied to the code block and edited. There are some out of the box functions such as:
calculateMin e.g. calculateMin([1,3]) –> 1.
calculateMax
calculateMean
calculateMedian
calculateMode
calculateStdDev
calculateSigmoid
calculateGeometricMean
calculateHamronicMean
Test: A manual testing block with sample values to evaluate the logic.
Visulization
There are three types of visualization:
Real Time
Historical
Input
Real Time
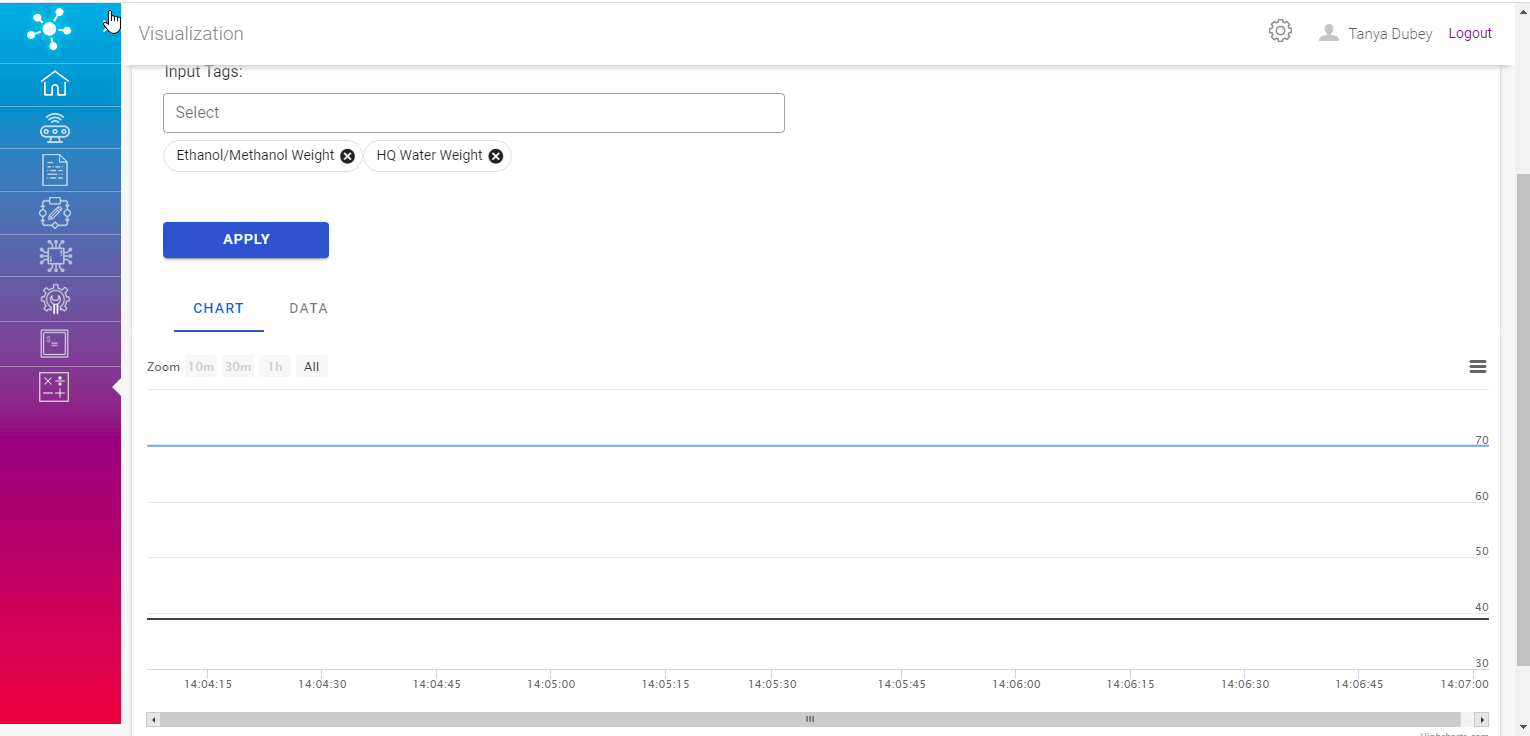
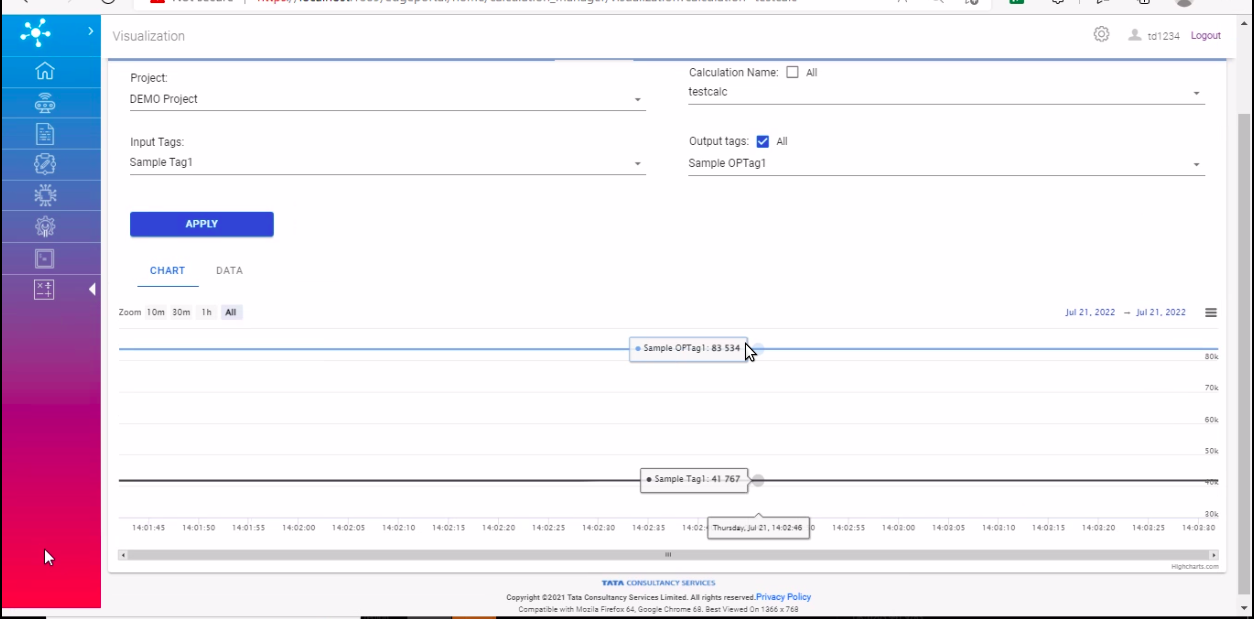
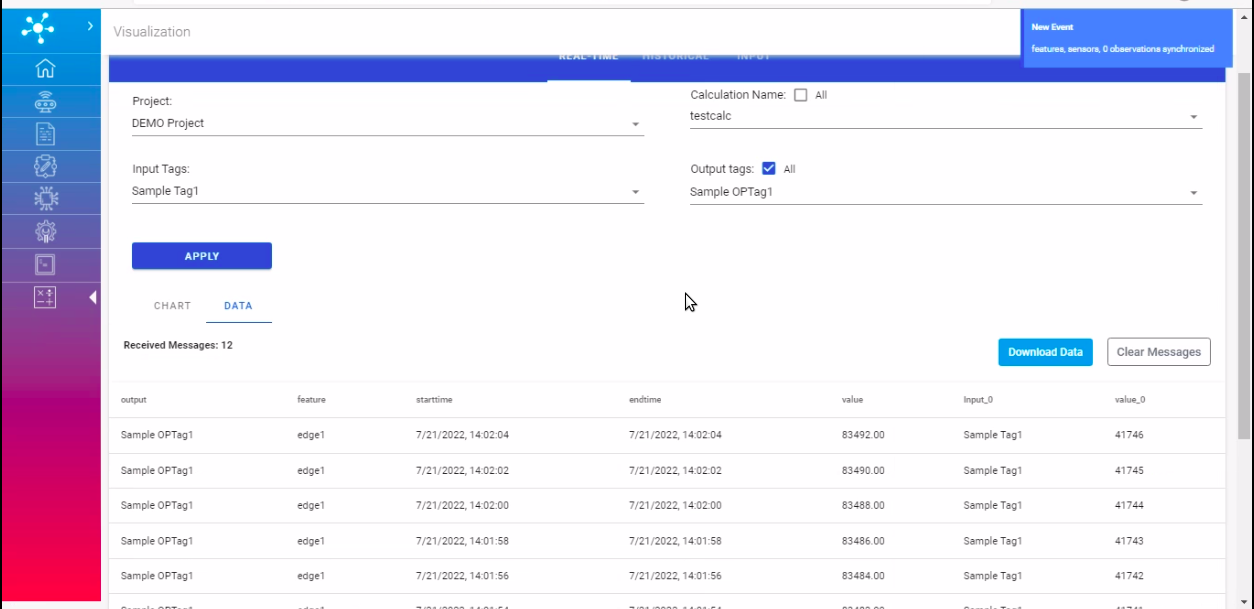
Here, real time data of calculations can be viewed with appropriate selections.
Project: This field contains options to select from the list of projects tagged to the user.
Calculation: This field contains options to select from the list of calculations under the selected project.
Input Tags: This field contains multiple select options of input tags tagged to the selected calculations.
Output Tags: This field contains multiple select options of output tags tagged to the selected calculations.
Historical
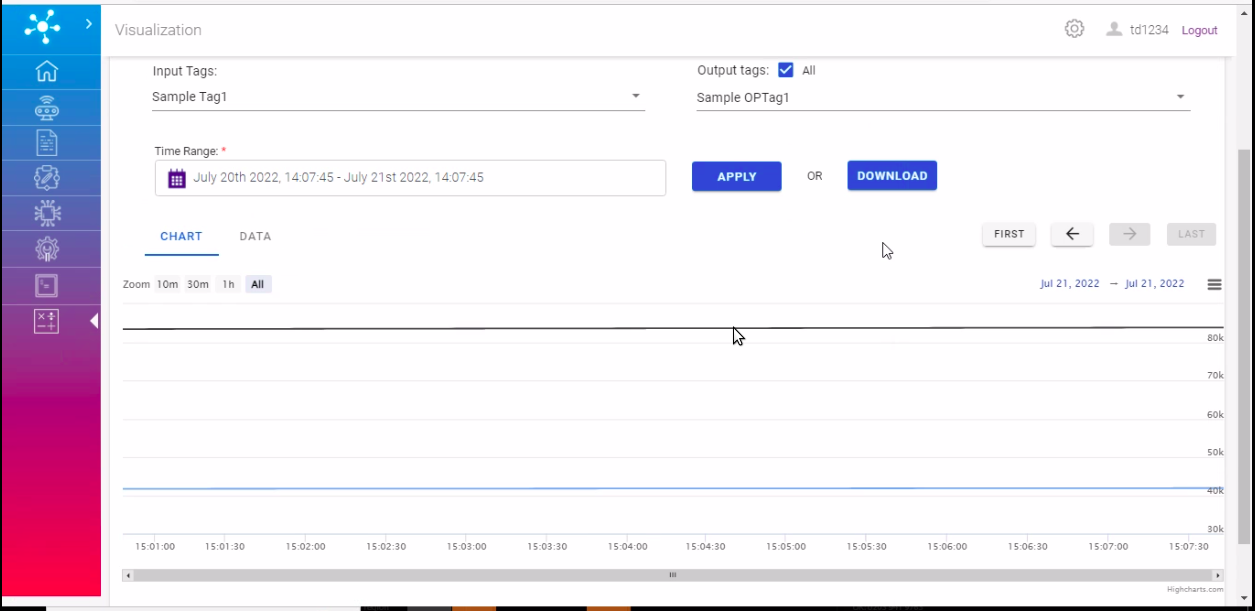
Here, historical data of calculations based on some time range can be viewed with appropriate selections.
Project: This field contains options to select from the list of projects tagged to the user.
Calculation: This field contains options to select from the list of calculations under the selected project.
Input Tags: This field contains multiple select options of input tags tagged to the selected calculations.
Output Tags: This field contains multiple select options of output tags tagged to the selected calculations.
Time Range: This field contains a particular time range of data to fetch.
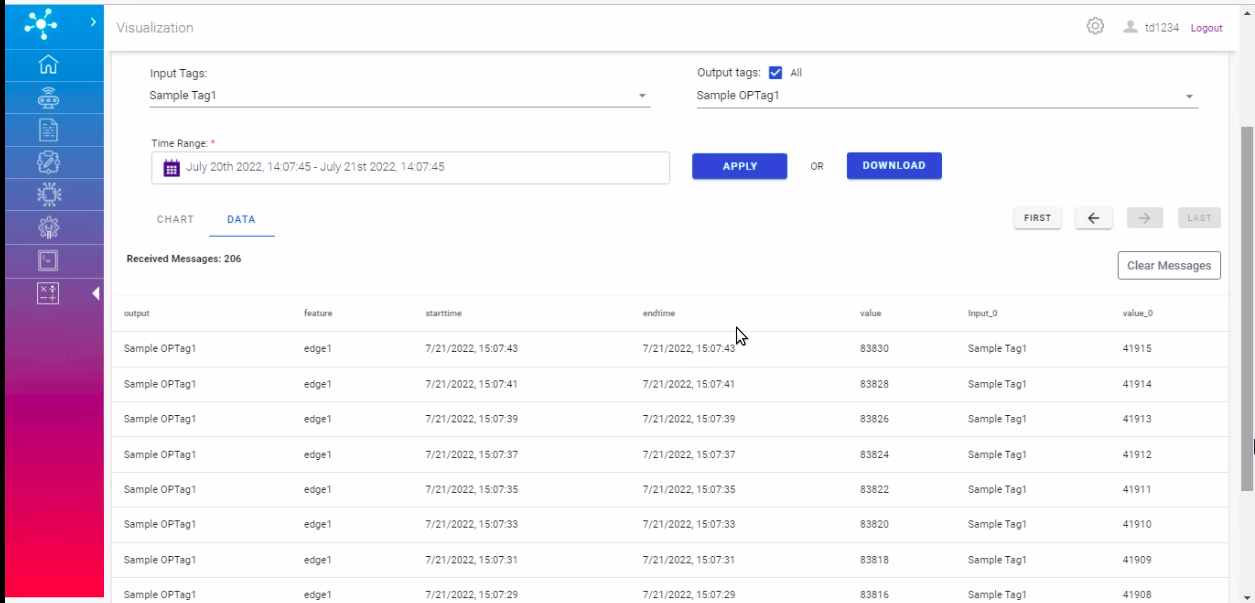
Input
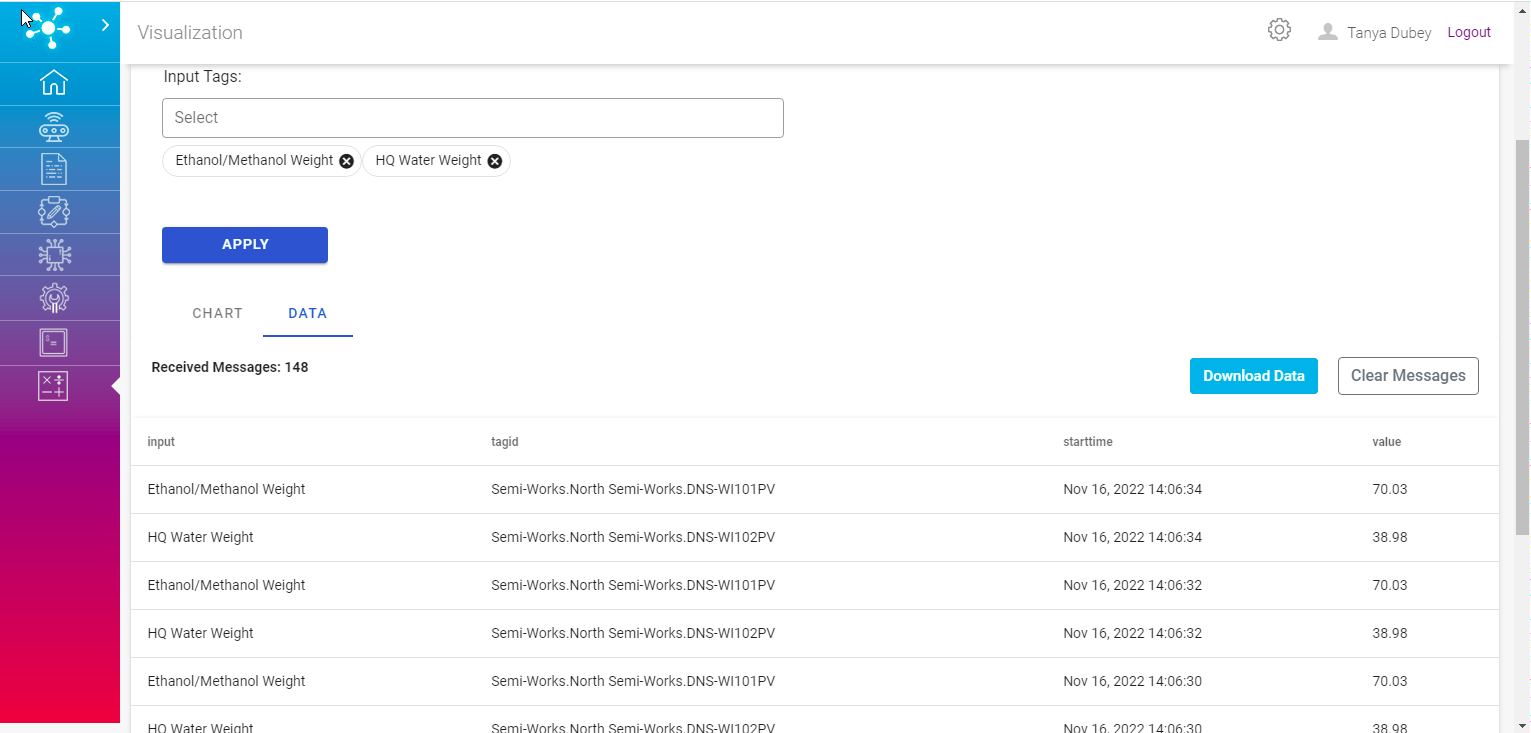
Here, raw data of input and output tag from the source, which can be utilized for setting more accurate calculation, can be viewed with appropriate selections.
Project: This field contains options to select from the list of projects tagged to the user.
Input Tags: This field contains list of input/output tags within a project.
