Sensor Data Explorer
Introduction
Sensor Data Explorer (SDE) is a tool for viewing, filtering, performing basic statistics and data visualization on sensor data from various sources like SOS, DLS and Local System. It is an application in TCUP which enables user to register sensor, create data sources, view a data source’s data in different forms (grid and chart) perform basic statistics over data etc.
Purpose of the Document
The following document describes the basic steps to work with Sensor Data Explorer. After going through this, the users will able to
Create Data Sources
Register Sensor in SOS
View, Edit & Delete the list of Data Sources.
Explore each Data Source
Working with Sensor Data Explorer
Accessing Sensor Data Explorer
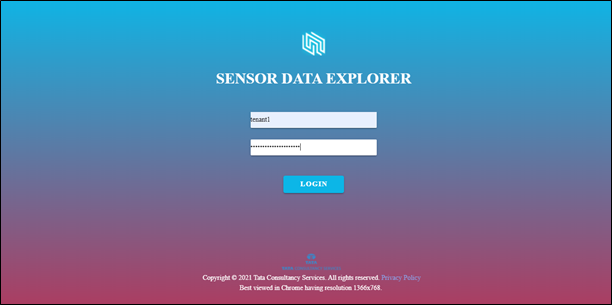
Users can login to Sensor Data Explorer by providing a valid user name or tenant name and the corresponding valid password. User must have SDE service subscribed along its corresponding policies/permissions. To make full use of SDE functionalities user should have either SOS or DLS or both services subscribed along with SDE.
Link for accessing DLS portal is : https://<DomainName>/sde-ui/
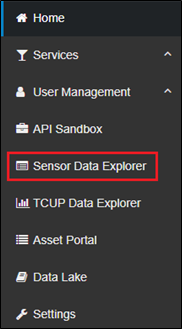
Alternately, users can also access Sensor Data Explorer by clicking on ‘Sensor Data Explorer’ from the left-hand side menu after signing in to TCUP.
After logging in the users would be redirected to the dashboard page:
SDE Dashboard
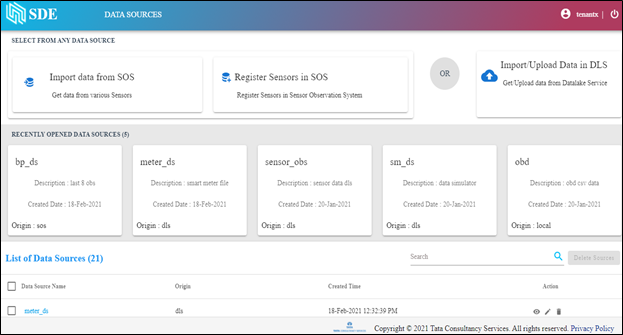
In the SDE ‘Dashboard’ page, the user would be able to see the following options:
Import data from SOS
Register Sensors in SOS
Import/Upload data in DLS
Recently opened data sources
List of data sources
Import Data from SOS
This section enables user to import existing data from SOS. On clicking Import data from SOS user will land to the page as shown in the following figure.
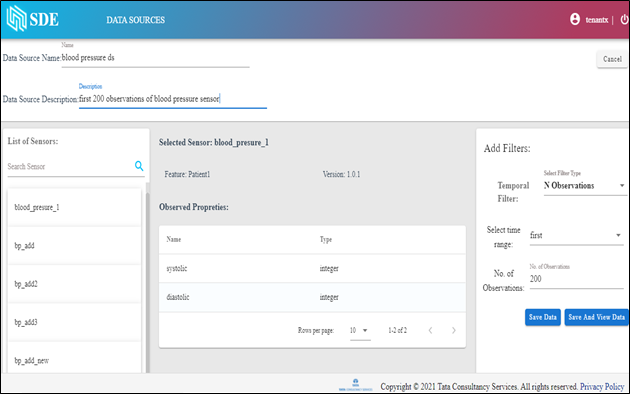
Here user will be able to see the already created sensors. User must provide a data source name, description and then select the required sensor from the list of sensors. Now the user needs to select filter. Following filters are available in the filter drop down
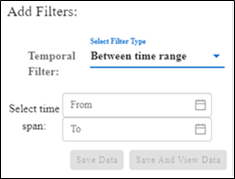
Between Time Range – Here user have to select the start date/time and the end date/time for the datasource.
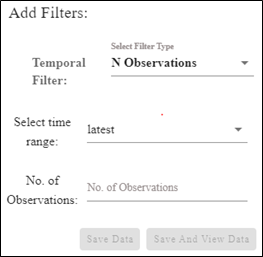
N Observations – Here the users have the option to select 1st or last N observations.
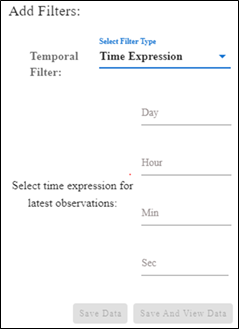
Time Expression - User can select a required time span to fetch the latest observations for a particular sensor. For eg: 1 day 3 hours 23 min 2 sec.
After filling up all the required fields click on the Save Data button or Save and View Data button to create a data source successfully. Save Data will create a data source whereas Save and View Data button will create a data source as well as navigate the user directly to the data source specific Explorer page.
Register Sensor in SOS
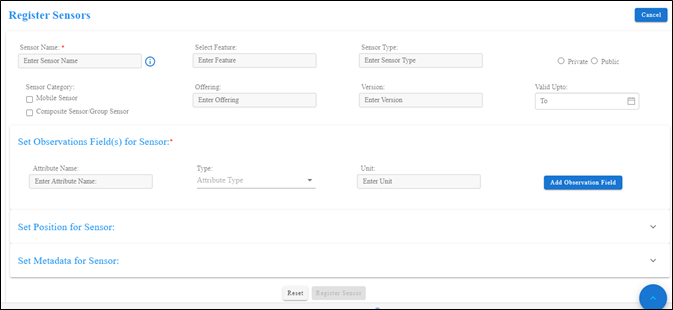
This section enables user to create new sensor. On clicking Register Sensor in SOS user will land to the following page. After adding all the required data click on register sensor button to create a new sensor. Please note if you attach the sensor with feature the feature should already be present in the system.
Import/Upload data in DLS
On clicking Import/Export data in DLS user will land to a page which enables user to either import data from DLS Catalogue or Upload data from Local System to DLS Catalogue.
Import Data from DLS catalogue
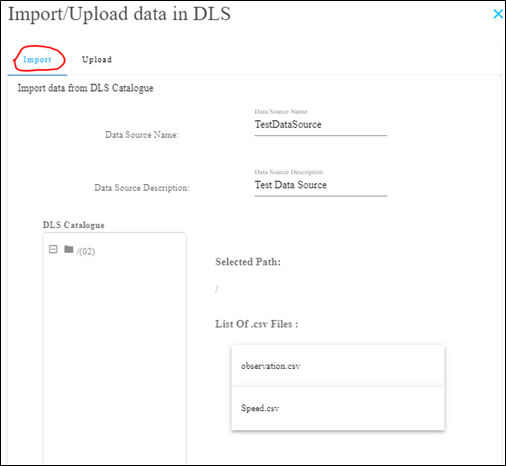
To import data from DLS user need to give the data source name and data source description. Then on clicking the desired folder from DLS Catalog field all the available CSV files are listed on right hand side. Select the required file and click on the Save as Data Source button to create a data source successfully.
Upload data from Local System to DLS Catalogue
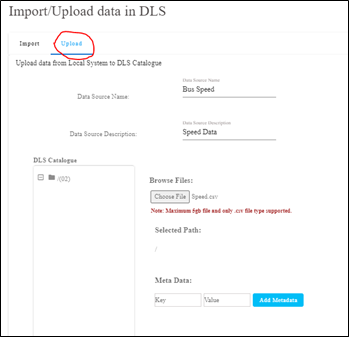
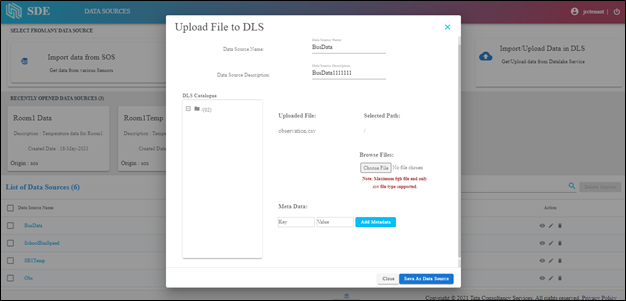
To upload data from local system to DLS, user need to give the data source name and data source description. Then select a desired folder from DLS Catalogue, where the file to be uploaded and browse the required .CSV file from user’s own device. User can add any metadata to the file being uploaded in DLS, using the Add Metadata button. Then clicking on the Upload &Save Data Source button will create a data source successfully.
Recently Opened Data Sources
This section displays the data sources which are recently opened by the user.
List of Data Sources
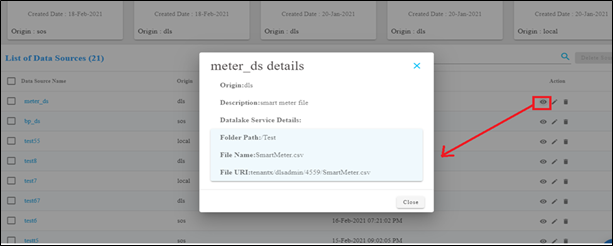
List of Data Source section in the main page shows all the available data source for that tenant which has been created before. Each data source details can be viewed, edited and deleted using the respective icons beside them. You can also explore data source by clicking on the data source name.
View Details of a Data Source
Following screen shows how to check the details of the data source.
Edit a Data Source
Clicking on edit button will redirect to the edit data source page. User will able to do the required modification there. Please note the Data Source Name is non editable.
Delete Single Data Source
User can delete a data source using the delete button next to the data source as shown in the fig below.

Delete Multiple Data Source
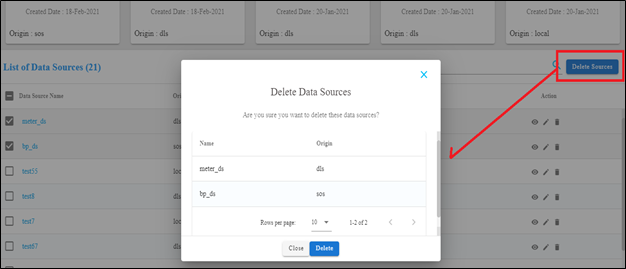
User can delete multiple Data Source in one go by selecting the data sources and then clicking the Delete Source button as shown in the fig below.
Explore Data Source
Clicking on the data source name, takes the user to the respective data source explore page.

In the explorer page 2 type of views are available. Graph View and Grid View.
Graph View
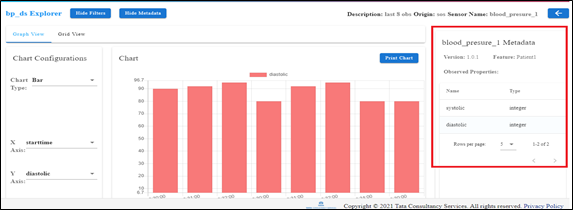
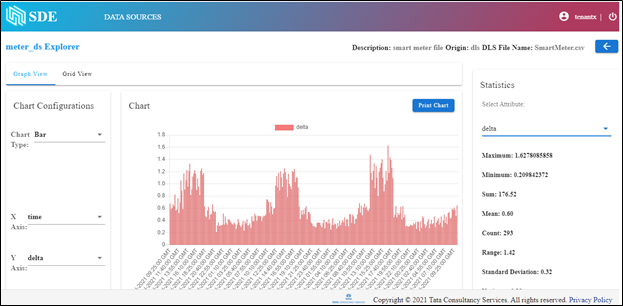
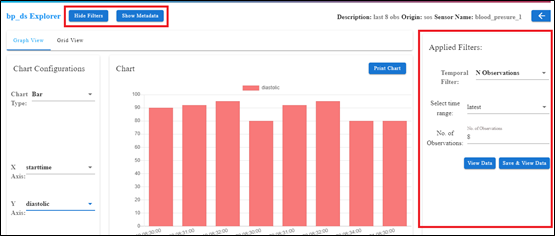
On the top left the data source name is displayed. On the right side, description, origin, Sensor name/ DLS file names are displayed. Chart view of the data source can be seen under the Graph View tab. User can select the required chart type (Bar, Line, Area, Scatter) , X- Axis and Y-Axis from the respective dropdowns in the Chart Configuration panel on the left side of the screen.
Grid View
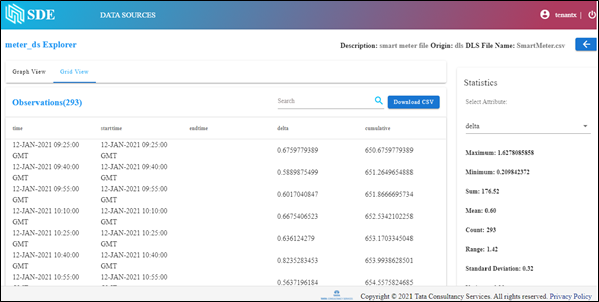
Observations are displayed in a tabular form in the grid view. User can download the observation csv file by clicking on the Download CSV button
If the data source origin is SOS, the explore page will have two extra buttons.
Show Filter
Show Filter button will show the user the selected filter criteria while the data source was created. After the filter details is displayed on the right-side panel, user can change the filter criteria if required. View Data will only load the new dataset without making any changes in the data source. Save & View Data will load the new dataset as well as save the changes in the data source.
User can hide this info using their corresponding toggle buttons Hide Filter.
Show Metadata
Show Metadata will display the metadata of the selected sensor in the right-side panel. User can hide this info using their corresponding toggle buttons Hide Metadata.
